Street Art CCSS.MATH.CONTENT.7.RP.A.1

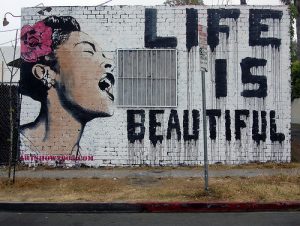
By Banksy, UK.

Street Art or Graffiti as we commonly know it has endured an evolving history, its origins linked to both urban gangs as well as to pure artistic expression. Originally used by gangs to mark their territory, it has have now become a rich medium for unrestricted expression of ideas and statements. From the Berlin Wall to the democracy wall in Beijing, people have used street art to demonstrate some of their most poignant frustrations, concerns, or expressions of beauty about the world. It is time to give students a look, into the empower political, artistic, and mathematics involved in changing our cityscapes. Through this lesson plan students have the opportunity to use math and art to connect with cultures around the world.

This lesson is suited for a 7th grade Math classroom and it gives us inclusive way to make mathematics more culturally accessible. Mathematics is often viewed as very Eurocentric. Students, regardless of background, often have an attitude of helplessness and powerlessness toward mathematics. This is done so by exposing them to ethno-mathematics. Ethno-mathematics is the study of the relationship between math and culture or the study of the mathematics practiced among cultural groups. The intent is to help students to realize the significance of math with their culture and other cultures. It reinforces the everyday value of math and the value in their ability to do mathematics. Explain to students that they will watch a video about an urban artist who uses ratios, scale, and proportion to plan and create his designs. Does anyone have any idea why? Have students plan out their designs on paper, they need to calculate the dimensions to figure out how to size the drawing properly on a large scale. Watch the video! And create.

Prior required knowledge: basic functions of math adding, subtraction, division, multiplication, basic reading, and writing. Vocabulary: ratio, scale, proportion, scaling, unit rate, factor, oppression, civil rights, gender, art, political science.

Materials: 1 drawing of their choice, centimeter ruler, 1/4″ grid paper, pencil per student. Colored pencils and large paper. Classroom internet access, viewing screen.

CCSS.MATH.CONTENT.7.RP.A.1 – Analyze proportional relationships and use them to solve real-world and mathematical problems. Compute unit rates associated with ratios of fractions, including ratios of lengths, areas and other quantities measured in like or different units.

CCSS.MATH.PRACTICE.MP4 – Model with mathematics.
I Have a Dream – 8.FB.4&5

Are we any closer to equality than we were in 1963?

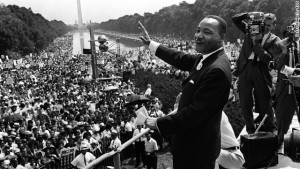
The civil rights leader Martin Luther KIng (C) waves to supporters 28 August 1963 on the Mall in Washington DC (Photo: AFP/Getty Images)
The civil rights leader Martin Luther King Jr. waves to supporters 28 August 1963 on the Mall in Washington DC (Photo: AFP/Getty Images)

Content and Practice Standards:
CCSS.Math: 8.F.B.4
CCSS.Math: 8.F.B.5
MP 4 – Model with mathematics.

Central Focus and Purpose:
Through experiment in mathematics and culture we will explore data in a series of graphs and evaluate whether we as a society are any closer to equality in the time that has passed. Students create models of linear functions and learn to recognize nonlinear function. They will find the slope of a linear function and evaluate what it means in terms of the economic, education, and social data in the interactive activity to determine whether we are any closer to equality.

Targets and Plan for Intended Learning:
Students will be able to calculate the rate of change and use the rate of change to interpret data in real-life graphs. Students will also be able to estimate a linear function over top of a graph that may not be perfectly linear.

Materials and Technology Needs:
For this assignment we will be using the classroom computer and projector to view short videos as well as read an article as a class. Worksheets for every student to complete (plus a few additional), calculators, pencil, and erasers. Students will be able to use the graphing calculator with the help of the teacher to find a line of best fit when appropriate to check their models.

Assessment Strategies:

  • The teacher will observe groups and look for possible student misconceptions to assure students are understanding what a linear function is and how to find the slope and ensure there are no problems caused by students making assumptions.
  • Help students with defining their variables correctly and answering the questions asked of them.
  • The teacher will ask groups to present their ideas and interpretations of the data. Other groups will be asked to comment and make connections to the material. Students must demonstrate they constructed a linear equation, and solve for the slope of the line.
  • Formative assessment will be the teacher’s evaluation of the written responses that are submitted at the end of class as well as their observations during the assignment. Students must show critical thinking and math reasoning. They must show a linear equation and evaluation of the line for its slope.

Relevant Multimedia Links:

A Half-Century After the March on Washington, Would King Be Satisfied? (Article).

“I have a dream” Martin Luther King Jr. the March on Washington (Short Version YouTube).

Graphical slope of a line | Linear equations and functions (Instructional Material YouTube).

Graph Shop – Graphing Lines Thrift Shop Parody (YouTube).

Lesson Plan and Materials:

Lesson Plan I Have a Dream.

I Have a Dream – Worksheet.

Graph Data for Lesson I Have a Dream.