Graphing Linear Equations A.REI

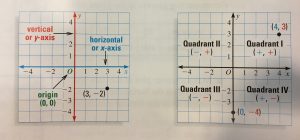
This learning progression is for a high school algebra class. In this unit, students will learn important concepts about graphing linear equations. In the first lesson,  students will learn about the different properties of a graph. For the second lesson, it will be broken down to two days. Students will check whether the set of ordered pairs are  solutions to both the equation and the graph. The next day,  students will be introduced to writing the equation as a function form. For the third lesson, students will  learn how to find the x-intercept and y-intercept  both algebraically and graphically.

The following Common Core State Standards will be satisfied in this unit:

The following Mathematical Practice will be satisfied:

Learning Progression is attached:

learning progression for edtpa
 

A Beginning Look at Calculus IF.B4

This learning progression is for a high school calculus class. This is the first unit of Calculus, where students will be introduced to the two goals of calculus. The learning progression will start first by students developing concepts of slope and slope functions. Students will show how particular functions change by examining finite differences.

The learning progression aligns the following Common Core State Standards:

MATH.CONTENT.HSF.IF.A.1

Understand that a function from one set (called the domain) to another set (called the range) assigns to each element of the domain exactly one element of the range. If f is a function and x is an element of its domain, then f(x) denotes the output of f corresponding to the input x. The graph of f is the graph of the equation y = f(x).

MATH.CONTENT.HSF.IF.A.2

Use function notation, evaluate functions for inputs in their domains, and interpret statements that use function notation in terms of a context.

MATH.CONTENT.HSF.IF.B.4

For a function that models a relationship between two quantities, interpret key features of graphs and tables in terms of the quantities, and sketch graphs showing key features given a verbal description of the relationship. Key features include: intercepts; intervals where the function is increasing, decreasing, positive, or negative; relative maximums and minimums; symmetries; end behavior; and periodicity.


The learning progression aligns with the following Mathematical Practices:

CCSS.MATH.PRACTICE.MP1

Make sense of problems and persevere in solving them.

CCSS.MATH.PRACTICE.MP2

Reason abstractly and quantitatively.

CCSS.MATH.PRACTICE.MP8

Look for and express regularity in repeated reasoning.


The learning progression can viewed at the link below

calculus Continue reading

What’s the Probability HSS.MD.B.5.&7.

After introducing a new topic in mathematics, students find it difficult to take what they have learned into practice. However, keeping students interested, active, and engaged in different activities makes a significant difference in their learning experience.

Students will come up with measures of chance. One of the questions that they can ask themselves is, “how can I quantify how likely an event is?” In this case, teachers can introduce this classic activity, using a standard deck of cards. Using a deck of cards provides a concrete look at probability and chance in a hands-on math activity. A typical deck of cards has four suits of thirteen cards in each suit, twelve face cards, four aces, twenty-six red cards and twenty-six black cards. Considering this, different probability questions can be asked to practice using this concept.


screen-shot-2016-11-10-at-12-36-55-pm

After introducing probability to your students, you can incorporate this activity within your lesson. Based on what they know about a standard deck of cards, students can answer questions, for instance, if you select one card randomly, what is the probability it is a heart?

CCSS.MATH.CONTENT.HSS.MD.B.5

(+) Weigh the possible outcomes of a decision by assigning probabilities to payoff values and finding expected values.

CCSS.MATH.CONTENT.HSS.MD.B.7

(+) Analyze decisions and strategies using probability concepts (e.g., product testing, medical testing, pulling a hockey goalie at the end of a game).

Allowing students to use the deck of cards to answer probability questions will help them reinforce their understanding. They will analyze and find strategies to know the probability of the specific card. This activity allows students to interact with their peers and reinforce their mathematical thinking of finding the probability of a certain card.

How fast is water decreasing? HSS.ID.B.5-6

How fast is water decreasing?

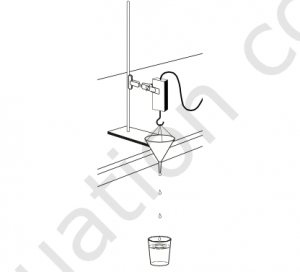
Students will be working in groups to find the relationship between weight of water versus the time water drains completely from the funnel.

In this activity, students will work in small groups to collect data, and based on the data points, they will interpret the slope of the line. Students will model the weight of water versus time data for a draining funnel. In addition, another objective that students will cover is that they will be able to describe the data using the concepts of intercept and slope of a linear function.

screen-shot-2016-11-01-at-10-45-42-am


This activity is aligned with:

  • CCSS.MATH.CONTENT.HSS.ID.B.5 Summarize categorical data for two categories in two-way frequency tables. Interpret relative frequencies in the context of the data (including joint, marginal, and conditional relative frequencies). Recognize possible associations and trends in the data.
  • CCSS.MATH.CONTENT.HSS.ID.B.6.A Fit a function to the data; use functions fitted to data to solve problems in the context of the data. Use given functions or choose a function suggested by the context. Emphasize linear, quadratic, and exponential models.
  • CCSS.MATH.PRACTICE.MP1: Making sense of problems and persevere in solving them.

Knowing the general equation of point-slope form of a line, students will write the equation of the line fitting the data collected. They will record the y-intercept in the data table. With their graphing calculators, students will determine if the line is the best fit for their data, and explain their reasoning if the line passes through any particular points.

How fast is water decreasing? Activity how-fast-is-h2o-decreasing

Chasing the Storm H.A.REI.1-3

screen-shot-2016-10-26-at-8-36-50-am

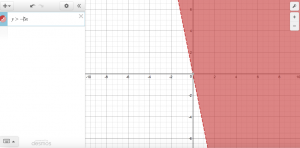
Do you want to incorporate an activity to reinforce students’ understanding about graphing inequalities? This activity will allow your students to apply their knowledge of inequalities, and apply it to a real world application. Students will be able to analyze a specific storm of their choice from The Weather Channel, and find the best equation that models the movement of a storm. Desmos is a free software where students can enter equations of their choice and analyze the graph of the expression. They will instantly see how the graph looks like after typing the equation. Students will be able to explore and find out how changing a constant or a variable can make a change. This resource is free and useful for student to familiarize themselves with different graphs.

Lesson Plan math-lesson-chasing-the-storm

Continue reading