5.G. Comparing Polygons

Target Grade: 4th-5th

Concept: Geometric Properties

Procedures: Categorizing, identifying properties of polygons

Common Core State Standards Targeted:

CCSS.MATH.CONTENT.4.G.A.2

Classify two-dimensional figures based on the presence or absence of parallel or perpendicular lines, or the presence or absence of angles of a specified size. Recognize right triangles as a category, and identify right triangles.

CCSS.MATH.CONTENT.5.G.B

Classify two-dimensional figures into categories based on their properties.

CCSS.MATH.CONTENT.5.G.B.3

Understand that attributes belonging to a category of two-dimensional figures also belong to all subcategories of that category. For example, all rectangles have four right angles and squares are rectangles, so all squares have four right angles.

CCSS.MATH.CONTENT.5.G.B.4

Classify two-dimensional figures in a hierarchy based on properties.

Alignment to CCSS:

While the the students are playing this game, they will be using properties of two-dimensional figures to classify and show relationships between the figures. Also, the students will be able to see and understand how attributes belong to subcategories of a category. An example that we used is that acute, obtuse, and right triangles all share the attribute of having interior angles that add up to 180⁰. Also, the students will be able to see how two-dimensional figures are in a hierarchy based on their properties because they will be using Venn Diagrams to assign properties. One example we used for the game was a rectangle and a square. This allows the students to see that they are both quadrilaterals and that a square is just a special type of rectangle.

Mathematical Practices Used:

  • Make sense of problems and persevere in solving them:  The students are provided with a situation in which they must accurately solve a problem within a time restraint.  The students are unaware of the properties they will need to categorize until the game begins.  Upon reading each of the given properties, students will analyze and make sense of what each property is describing, and then determine which category it belongs to.

  • Model with mathematics:  The students are able to physically manipulate the game pieces to place them in their proper category on a Venn Diagram.  Along with the boards and game pieces, students are physically able to compare and contrast cut outs of the two dimensional shapes.  These shapes are then used again when the students are asked to defend and support their findings.

  • Attend to precision:  The students must carefully read each property to fully understand what they are each describing.  Many of the properties are worded very similarly, but with one significant difference: For example, one property states “The sum of the internal angles equal 360 degrees”, whereas another property states “The sum of the external angles equal 360 degrees”.  The students must be able to differentiate between these subtle differences, while dealing with the time restraint.

  • Look for and make use of structure: The students must recognize what each section of the Venn diagram symbolizes in order to determine which section, properties should be placed into.  The diagrams of the two-dimensional figures below each of the Venn diagrams depict properties such as right angles and parallel lines.  Students may decipher these symbols in order to assist them in categorizing each property.

Technology:

The only use of technology in this activity would maybe be a document camera. This could be used to show how the activity works and what it will look like. Other than that, this is a very hands on activity that mostly uses paper.

Mathematical Modeling Aspects Present in the Activity

  • Realizing when revision need to be made: Students must be able to realize that their answers are incorrect and move the game piece to the proper place on the Venn diagram.

  • Identify important quantities and organize their relationships using such tools as diagrams, two-way tables, graphs, flowcharts and formulas: Students will have to know how to use a Venn Diagram in order to identify properties that pertain to certain polygons. It will be very important for them to know that some of the properties are shared by more than one polygon.

  • Analyze relationships mathematically to draw conclusions: The students will have to be able to analyze the relationships between polygons in order to place the properties in the correct spots on the diagrams. When the student draws a conclusion, that is when they have decided where the property goes on the Venn Diagram and why.


Objective: Students will be able to categorize two-dimensional figures based on their properties using Venn diagrams.

Time: Approximately 30-35 minutes dependent on total number of game rounds.Five minutes for introduction for game rules.  One minute per game round. Ten minutes for discussion questions.

Players: One player per Venn diagram poster at a time.

Materials: Venn diagram posters (attached), properties game pieces (attached), timer, whiteboard, and dry-erase markers to keep score.

Label each of the Venn diagrams as follows:

“Square vs. Rectangle”

“Right vs. Obtuse vs. Acute”

“Rectangle vs. Trapezoid”

You may use whatever comparisons you would like for this activity, these are the ones we chose.  The attached game pieces correspond to these comparisons.

3 Venn Diagram    2 Venn Diagram    PolygonProperties

How to Play:

  1. Lay out each game board (Venn diagram poster) throughout the room.

  2. Divide the students into even groups(teams) for each available game board.

  3. Create a scoring table to record the points for each team.

  4. One student from each team will go at a time.  When the time begins, the participating student will flip over the game pieces and begin to place and rearrange them on the game board until the minute is up.

  5. After the minute has passed, the instructor will go around to each board to count up the number of correct placements of game pieces to determine the number of points.

  6. Each correct placement is equal to one point.  Record the points for each team.

  7. Repeat steps 4-6 until each student from each team has completed their board.

  8. Teams will then rotate to the next board, and repeat steps 4-7 until each team has completed each board.

  9. Count the total number of points for each team to determine the winner.

Adaptations:

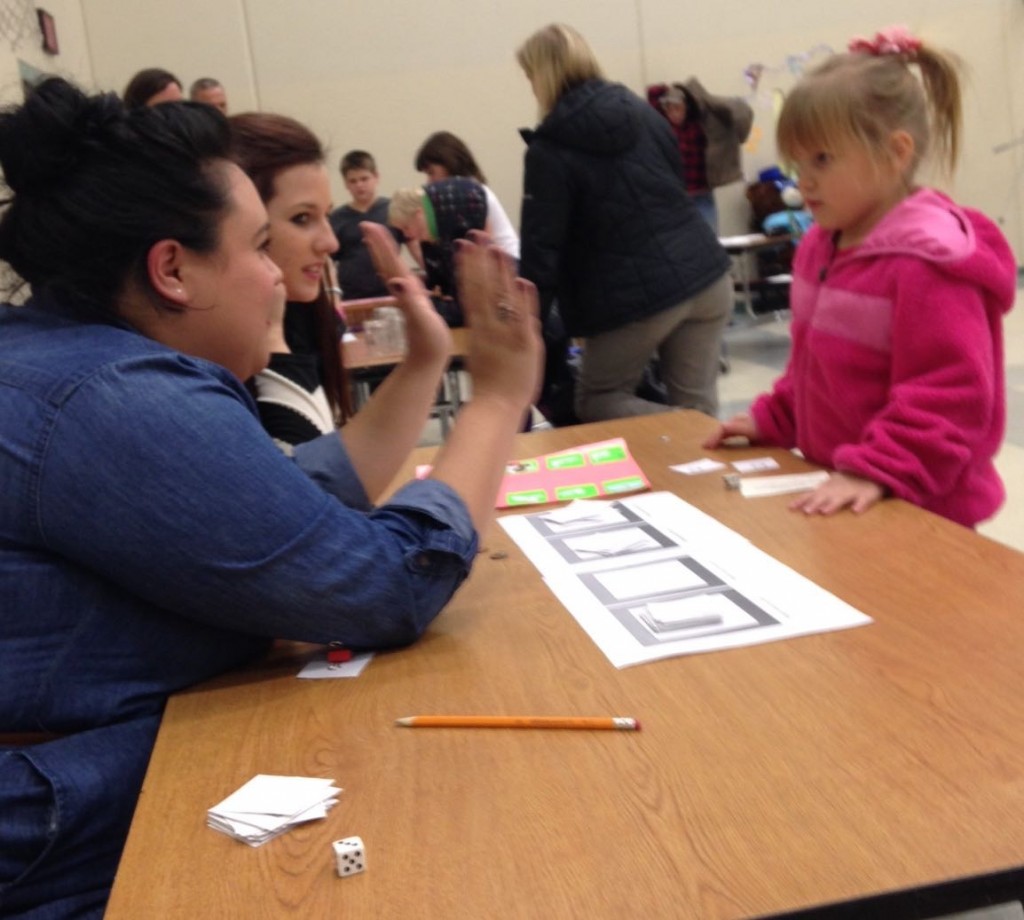
This activity can easily be modified for students at a wide range of grade levels. For example, instead of using a Venn Diagram, you can use a T chart and cut outs of different shapes to have younger students seperate them out into triangles and rectangles. This was a good activity for Kindergarten, 1st, and maybe 2nd grade. Also, asking that age group why they know which shapes are rectangles and which shapes are triangles was very beneficial.

This activity can also be modified for older students. This could easily be set up for a high school geometry class. One modification would be to use very specific properties for shapes such as hexagons, heptagons, and so on. Another way to raise the difficulty would be to use three and four way Venn Diagrams. This would really allow the students to demonstrate their knowledge of the relationships between different polygons.

Discussion Questions:

  • What strategy did you use to get the properties in the correct place?

  • What did you get wrong? Why?

  • Why is it important to know about different shapes?

  • Where can this knowledge be used in real life?

  • What more would you like to learn about polygons?

Wrap Up:

The wrap up will be very important to the students because it will allow them the opportunity to put into words their strategies, struggles, and successes. By students discussing the activity, they will be able to see connections they may have missed during the activity and make the ideas and concepts more concrete. Also, this is a great time to clear up any questions or concerns from the students. In addition, the wrap up is a great time to informally exam assess your students and get feedback for the next time you do this activity.

5.NF-FrAcTiOn fUn – Add and subtract fractions with unlike denominators


FuN wItH fRaCtIoNs  by Mike Prelesnik & John Broin

Target Grade: 5th grade

CCSS:  5.NF.A.1   Add and subtract fractions with unlike denominators (including mixed numbers) by replacing given fractions with equivalent fractions in such a way as to produce an equivalent sum or difference of fractions with like denominators. For example, 2/3 + 5/4 = 8/12 + 15/12 = 23/12. (In general, a/b + c/d = (ad + bc)/bd.)

CCSS:  5.NF.A.2   Solve word problems involving addition and subtraction of fractions referring to the same whole, including cases of unlike denominators, e.g., by using visual fraction models or equations to represent the problem. Use benchmark fractions and number sense of fractions to estimate mentally and assess the reasonableness of answers. for example, recognize an incorrect result 2/5 + 1/2 = 3/7, by observing that 3/7 < 1/2.

Mathematical Practices:

Make sense of problems and persevere in solving them–This is achieved when the project is started with the explanation of what the whole is and how a fraction is breaking the whole into “pieces”  and then adding  “pieces” together from different wholes in order to get an equivalent sum.

Reason abstractly and quantitatively–When  introducing  fractions with different denominators and show the students that they still equal the same whole, the students then start to look more abstractly at the task and start putting together that 3/3 is the same as 2/2  and also finding it incorrect to add 1/3  and 1/2 unless the pieces are converted into the same size piece and they see this visually.

Model with mathematics–This is accomplished throughout the entire project starting with the teacher modeling right up front about what our whole number is and continues through the students modeling the actual addition of fractions using the tools provided (which also covers the Practice of  “Use appropriate tools strategically”)

Attend to precision–This practice comes in different forms for this project.  Each strip is broken down into smaller and smaller pieces (sizes) and it requires extreme precision to make sure that 5/6 and 7/8 aren’t mistaken as the same size.

Materials and Equipment:

There is no technology needed for this modeling activity.  All that is needed is precut strips of paper of equal size and shape, colored pencils, white board, and the worksheet.  You can also purchase plastic folding strips from a teachers supply store if budget permits.

Modeling Activity:

This activity helps teach the mathematical concept of adding fractions by using strips of paper to represent the whole and then folding the strips to help represent how many pieces the whole is split up into.  This is a hands on activity that will give the students a visual representation of the value of each fractions

In reaching the CCSS of 5.NF.A.1 (which is replacing given fractions with equivalent fractions in order to produce an equivalent sum)  the students will each have several strips of paper, all of equal shape and size.  Each student will then be asked to represent the value of 3/5 by folding the strip into 5 equal parts and then shading 3 of these parts with a colored pencil.  The students will then use a different strip to represent the value ¾ using the same procedure.   The student will then use these 2 strips and discuss in groups of 4 how they can add the pieces together.   The teacher will walk around the classroom during this part of the activity and ask leading questions to help the students discover, on their own, the conclusion that if you break each piece into the size of piece from the other strip, that they will become equivalent size pieces on both strips, and then they can count the shaded parts and add those together.   Once the teacher is satisfied that the groups have a clear understanding, a representative from each group should stand up at the white board and show, graphically, how they added their 2 fractions.

See video for visual reference:  http://www.youtube.com/watch?v=lidrNnp2ga0


Addressing CCSS: 5.NF.A.2  is done through the worksheet that is sent home with the students for a more summative assessment.  This worksheet will have the Title picture above to give the student a visual representation of a whole broken down into different size pieces.  Then,  a set of story problems for each student to work out on their own will involve real world application like using recipes and having  to adjust them to meet different scenarios.  I.E.

1. You give 1/3 of a pan of brownies to Susan and 1/6 of the pan of brownies to Patrick. How much of the pan of brownies did you give away?


2. You go out for a long walk. You walk 3/4 mile and then sit down to take a rest. Then you walk 3/8 of a mile. How far did you walk altogether?


Adaptations:

For students who are having a hard time understanding the procedure of breaking each piece of one strip into the size of piece from the other strip, the teacher can simplify the problems by using larger fractions like ½ and 1/3.  Also, you could draw the activity on a full size sheet of paper representing each fraction as a bar that is broken into its respective pieces and then have the students write down what they see on the paper.


Discussion Questions:

1.   What’s the top number of a fraction represent?

2.  What’s the bottom number of a fraction represent?

3.  Why can you add the top numbers if they are different but you can’t add the bottom number if they are different?

4.  Can the top number be larger than the bottom number?  If so, what does this represent?

5.  Is it possible to have 2 different denominators and have the fractions be equivalent?

6.  Where would you use these skills in the world outside of the classroom?


6.EE – Solving Problems While Playing a Game

Racing Lincolns

Racing Lincoln

Standard:

CCSS.Math.Content.6.EE.B.7 Solve real-world and mathematical problems by writing and solving equations of the form x + p = q and px = q for cases in which p, q and x are all nonnegative rational numbers.

Preview Questions:

1. What is the order of operations?

2. What are the steps to solve an equation in the y=mx+b format if the   elements {m, x, and b} are given?

Purpose of Game: The purpose of this game is to help reinforce students understanding of solving equations with letter variables. The students will solve linear equations using the number they rolled on their dice as an x-input and the output will be either a negative or positive whole number.

Objective of Game: The objective of the game is to make it to the end space first!

List of Materials:

One penny for each player

A game board for each group

One dice for each group

A set of flashcards for each group

Scratch paper to solve problems

Rules:

  • This game can be played with 2-4 people.
  • The set of cards are shuffled and placed in the center of the table.
  • Each player chooses a penny as his or her game piece.
  • Each player rolls the dice to see who goes first.
  • Player 1 chooses a flashcard from the deck and rolls the dice. The player will solve the equation using the number on the dice as the x-input.  The y-output will be how many spaces the player moves on the game board.
  • If the player lands on a space with a red arrow, the player must move to the space that the red arrow indicates. If the player lands on a regular blue arrow, the player’s token stays on that arrow until their next turn.
  • If a player notices that a fellow racer solved an equation incorrectly, the player can challenge their opponent and solve the equation correctly. The player that solves the equation correctly can move their token the correct amount of spaces and the player that answered the question incorrectly does not move their token.
  • The next player will do the same, and the players will repeat this process until one player reaches the end point of the board first.
  • The first person to reach the end first wins.

Modeling Example:

Teacher: We are about to start a round of Racing Lincolns—in this game each of you will be given a different colored penny as your token, the first penny to reach the end of the board will win. I will play a turn for all of you to show you how to play.

Teacher: First I am going to pull a flashcard to see what equation I will need to solve. I have just pulled a flashcard that reads “y=2x-3”, and I have just rolled my dice and the face reads five. Once I solve the problem I see that my solution is seven, which means that I get to move my penny token to the seventh spot on the game board.

Teacher: If I was playing in a group all of my partners would do the same and we would continue until one of us reaches the end point on the game board.

Teacher: If all of you have your game pieces and understand how to play then you are all set to get into groups of two to four and play the game.

Teacher: May the best Lincoln win!

Adaptation:

1)    For older students, the flashcards will be in quadratic form.

2)  For younger students, the  flashcards will be in the format “3 + ____ = ?” instead of in y=mx+b format. The flashcards would only have a positive output.

Follow-up Questions:  

               Complete the Racing Lincolns Pit Stop worksheet.

 Lesson plan with Worksheets

7.EE-Calculating Wages and Tips

 7.EE-Solve multi-step real-life and mathematical problems

Algebra:

CCSS.MATH.CONTENT.7.EE.B.3
Solve multi-step real-life and mathematical problems posed with positive and negative rational numbers in any form (whole numbers, fractions, and decimals), using tools strategically. Apply properties of operations to calculate with numbers in any form; convert between forms as appropriate; and assess the reasonableness of answers using mental computation and estimation strategies.

Problem:

Joe works at a concessions stand at Century Link Field. Joe makes $10 per hour plus any tips he gets from the generous football fans. Set up and solve an equation for EACH of the given problems and write your answer using complete sentences.

  1. Set up a general equation for the total amount of money Joe will earn working at the concessions stand. Define your variables.
  2. How much money does Joe make if he works 4 hours and makes $17 in tips?
  3. If Joe makes $86 dollars total, and earned $31 dollars in tips, how many hours did he work?
  4. Joe worked with Steve during the Seahawk v. 49ers game. They worked 6 hours and made $46 in tips together. If Steve and Joe split the tips evenly, how much money did Joe make during that game?

Commentary:

The purpose of this problem is to illustrate the Common Core State Standard of applying a real-world situation to learning how to set up and solve single variable equations. The students learned how to manipulate one and multi-step equations. Teachers can use this problem as a summative assessment. This problem gives them the chance to reason how to set up an equation using information that is provided for them. Students are able to define variables for an equation and use values to evaluate for the unknown variables. The students use the additive and multiplicative inverses to further their mathematical understanding of solving equations. The students will get a chance to change an equation so that it fits what a question is asking. For example, changing the original equation from T=10x+y to T=10x+(y/2) to factor in the tips being split. The story problem has multiple parts, so this gives the students the opportunity to read and follow directions carefully.

Solution:

  1. Let x be the number of hours that Joe worked, let y be the number of tips in dollars, and let T be the total number Joe earned in dollars. The student can pick any variable for the given information but the equation must be set up in the correct order. The number of hours worked must be multiplied by the wage, so 10x. Then the tips will be added to that making the entire equation T=10x+y.

x= number of hours worked

y= number of tips earned in dollars

T= total number dollars earned

T=10x+y

2. The number of tips, $17, should be plugged into y for the given equation.

T=10x+17

Then since we know that Joe worked for 4 hours, we can evaluate when x=4.

T=10(4)+17

T=40+17

T=57

            Joe earned $57 total.

3. The total number of money that Joe earned was $86 dollars and his tips were $31. For the equation the students must evaluate when T = 86 and y = 31. Then the students must solve the equation for x.

86=10x+31

55=10x

5.5=x

Joe worked for 5 and a half hours.

4. Since the amount of tips earned were shared by 2 people, the total number of tips needs to be divided by 2 to find Joe’s share.

T=10x+(y/2)

            Then evaluate the equation when x = 6 and y = 46.

T=10(6)+((46)/2)

T=60+23

T=83

            Joe earned $83 total.


4.OA – Cards Up … Seven Up

cGmSuits


Target Grade: 4th \ 5th (However, easily adapted to other grade

Concept: Operations 

Procedures: Addition, Subtraction, Multiplication, and Division

Common Core State Standard Targeted:

CCSS.MATH.CONTENT.4.OA.A.2

Use the four operations with whole numbers to solve problems: Multiply or divide to solve word problems involving multiplicative comparison

While playing this game, students are using all four operations, with an emphasis on multiplication and division, to solve a real world problem. By definition, a real world problem is something that is concrete, not abstract, and uses a concept in a real setting or application. To students, a game qualifies as such. Therefore, this game targets and helps students to meet this standard. The game could be used to teach and practice the standard or assess the mastery of it.

Mathematical Practices Used:

  • Make sense of problems and persevere in solving them: The students are given a situation where they are asked to problem solve as there is no one “right” way to solve the problem. The students are also asked to work through situations in which a pre-described method or set of steps is not provided to them. They must utilize strategy when playing against themselves or a partner, and must make adjustments to that strategy, in order to use the most cards and ultimately win the game.
  • Model with mathematics: The students are modeling the situation as they create number sentences (with the cards) that represent the given situation (product number), which exemplifies the use of modeling with mathematics. By modeling, the students are taking an abstract concept of operations and are turning it into a concrete and tangible representation. This transfer from ideas on a page to the tangible real world, in the form of a game, can solidify knowledge in students. It can also give the students a reason why it is important to learn, adding motivation for the students to master the concept. Lastly, modeling can make the concept come alive, leading to better retention, higher ability to transfer the knowledge, and allowing for higher thinking skills to occur in regards to the concept.
  • Look for and make use of structure: The students are taking a general idea of operations and using it in a specific situation, using the structure of the operations as their guide to solve the problems.
  • Construct viable arguments and critique the reasoning of others: The students will engage in dialogue about their mathematical reasoning as they explain to their partner how they arrived at their target number. The partners will have discussion about whether or not they agree as well as what modifications would need to be made to make the equation true.  

Technology

A use of technology that could be included in this activity would be the use of a calculator. However, the purpose behind the activity was to practice mental math and quick access of math facts. This purpose would not be served if the use of a calculator was permitted.

Mathematical Modeling Aspects Present in the Activity

  •  Realizing when revisions need to be made: Students must realize when their answers are incorrect and make the necessary changes in order to make their equation equal their targeted number.
  •  Make improvements on their model or strategy: Students will choose a strategy that gives them the most cards. However, as the game is continued and more time is spent playing the game, students may change their strategy in order to receive more cards. Strategy may also change when playing with a partner versus themselves. This idea of strategy and how it changed is discussed during the wrap up period.
  •  Interpret their mathematical results in the context of the situation and reflect on whether the results make sense: Students will evaluate their answers through self-check and peer discussion to establish of their results makes sense and are correct.

Objective: Students will be able to use multiple operations (addition, subtraction, multiplication, and division) to create equations that equal specific answers.

Time: 25 – 30 minutes (with an additional discussion and wrap-up for an extension, if applicable or time permitting)

Players: One or two

Materials: Deck of cards (with jokers and face cards removed), two dice, one tally sheet* per partner (if playing in partners), one board* per partner (optional)

*Tally Sheet Master           *Board          Directions

How to Play – Individual:

  1. If not already done, remove the jokers and face cards from the deck of cards.
  2. Shuffle the cards.
  3. Roll the two dice and multiply the numbers together. This is your target number for this turn.
  4. Take the first seven cards of the deck and flip them face up, placing them in a row (on the board spots if using one).
  5. Using the seven up facing cards, add, subtract, multiply, and\or divide the numbers to achieve the target number. The object of the game is to use as many cards as possible of the seven facing up. (Note: Ace cards are worth 1)
  6. After the target number is achieved, place the used cards in a pile to the side (or on the board where labeled) and leave the remaining, unused cards in the row.
  7. Replace the used cards so seven cards are facing up again.
  8. Roll the dice again for a new target number and complete steps 3-7 until the deck is gone.
This is the set up for the start of every turn: seven cards facing up, lined up on the board, and two dice.
The student's target number was 30. They arrived at that target number by completing the following operations: 6+4=10, 10X4=40, 40X1=40, 40-10=30.
The student’s target number was 30. They arrived at that target number by completing the following operations: 6+4=10, 10X4=40, 40X1=40, 40-10=30.
After the target number has been achieved, stack the used cards in the last card spot, replace the cards so seven are facing up, and roll the dice for the next target number.

How to Play – Partners:

  1. If not already done, remove the jokers and face cards from the deck of cards.
  2. Shuffle the cards.
  3. Determine which partner will go first.
  4. Distribute seven cards to player one. Player one will take the seven cards and flip them face up, placing them in a row (on the board if using one).
  5. Player one will roll the two dice and multiply the numbers together. This is their target number for this turn.
  6. Using their seven up facing cards, player one will add, subtract, multiply, and\or divide the numbers to achieve the target number. The object of the game is to use as many cards as possible of the seven facing up. (Note: Ace cards are worth 1)
  7. After the target number is achieved, player one will explain to player two what operations and steps they used to get to their target number.
  8. Player two has the opportunity to challenge any flaws they see in player one’s explanation at this point.
  9. Once the two players have agreed on the equation and the target number was achieved, player one will place the used cards in a used card pile on the table (or board), tally how many cards they used, and leave the remaining, unused cards in the row.
  10. Now it is player two’s turn. Player two will place the next seven cards in the deck on their board.
  11. Player two will follow the same steps listed in direction number 5-9.
  12. At the start of each players next turn, they will need to replace the cards so that seven cards are facing up at the start of each turn.
  13. The players will alternate turns, following directions 5-9, until the deck is gone. Once the deck is gone, a winner will be determined based on which partner has the most tallies.

Adaptations:

For students who need a change of some kind, rules can be set that changes what operations the students can use. The rules can limit, expand, or include all operations to meet the student’s needs.  Rules can also be made that set a minimum in the number of cards that must be use in order to challenge the student with how many operations they use in order to use that many cards and still achieve the target number.

For example, students who are below the fourth grade level, the game can be adapted to use only addition and subtraction for both the target number operation, and the operations used to achieve that target number.

An example for students who are above the fourth grade level would be to set a minimum of four cards to be used each turn so that the student must challenge their thinking in order to use more cards.

Discussion Questions

  1. What was a strategy that got you the most cards?
  2. Was the strategy that you used different when you played against yourself than when you played against a partner? If so, how was it different?
  3. Did you and your partner have any disagreements about their reasoning or mathematical equations? If so, what were they? How were they resolved?
  4. Which operation did you use the most? Why do you think that was?
  5. Which operation did you use the least? Why do you think that was?
  6. How are these skills used in real life?
  7. Why are these skills important to learn?

Wrap Up

By allowing the students to engage in math talk about the game that they just played, mathematical connections can be drawn and the students can really dive deep into the embedded concepts as well as the mathematical practices that are included in the game. This discussion can serve as a reflection and a time for further and deeper mathematical learning to occur. Of course, these questions can be used as a quick debrief or a more extensive conversation starting point.

Game Adapted from:

Currah, J., Felling, J., & MacDonald, C. (1992). All hands on deck, math games using cards and dice. (Vol. 2). Alberta, Canada: Box Cars & One-Eyed Jacks

6.EE-Using Algebra Touch to Simplify Algebraic Expressions & Equations Using Distributive Property

The Algebra Touch app gives students the opportunity to physically move numbers and variables around an iPad screen to better understand how to simplify algebraic expressions.  Students who are trying to solve algebraic expressions on paper out of a textbook have a hard time seeing what needs to be done first and the steps to simplify.  With this app, students get walked through the procedures and have visual aids to help them understand what is really going on mathematically.

In this lesson, students will learn how to solve different algebraic equations and simplify expressions with an emphasis on the distribution property.  Students are already knowledgeable of how to simplify algebraic equations and expressions by addition, subtraction, multiplication, and division.  Algebra Touch allows students to visualize the reason why the distributive property works.  Teachers can explain the distributive property with some examples on the whiteboard, but once the students get the opportunity to manipulate the different parts of expressions themselves on the iPad, it will deepen their understanding.

Algebra Touch Lesson Plan

Algebra Expressions and Equations Worksheet

(Video showing steps on how to distribute and factoring out using Algebra Touch)

7.SP-Friends Around a Table

Illustrative Mathematics Modeling

Friends Around a Table

Composed by Don, Maile, and Nia

IMAG0306

CCSS addressed:
7.SP.C.8.a: Understand that, just as with simple events, the probability of a compound event is the fraction of outcomes in the sample space for which the compound events occurs.

7.SP.C.8.b: Represent sample spaces for compound events using methods such as organized lists, tables and tree diagrams For an event described in everyday language, identify the outcomes in the sample space which compose the event.

Materials Needed:
• 4 miniature dolls per “table”
• 1 “table” (this can be a piece of cardboard, a book, or another square object)
• Paper and pencils

Lesson:
1. Hook:
Penguin, Tiger, Bear, and Frog are seated at random around a square table, one person to each side. What is the theoretical probability that Penguin and Tiger are seated opposite from each other?

IMAG0303

2. To do:
Students need to draw pictures or use manipulatives of the problem. They should list all the possibilities and record that number as the total. Then they should list all the outcomes where Angie and Carlos are seated opposite each other. They should list all the combinations were this happens and record that number as the desired outcomes. This fraction is the theoretical probability. Students should make a chart of their data. Students can work in small groups to solve this problem.

3. Discussion Questions:
• What are some ways we can figure out how to answer this question?
• How can we set up what we know in a way to help us solve this?
• What information do we know? What do we need to know?
• How many ways can these 4 friends sit around the table (with no duplicates of course)?
• What if Penguin decided that he did not want to give up his seat, how would this change the amount of possible sitting arrangements?

4. Wrapping up:
Students will discuss and share their totals (how many total sitting arrangements there are). Seeing if there are any “outliers” or numbers that just don’t seem to fit with the rest of the classes data (1 number just does fit with the rest). If there is an outlier then that number is thrown out of the “group” (that data is not used in the resulting discussion). Next, ask the students how many times they found that Tiger and Penguin sat across from each other. Students should look to their lists and come up with a single digit answer. Ask the students to use this number and create a fraction that incorporates their total number of sitting arrangements as a whole. Finally, ask the students, “what do you notice about the fraction you created and why do you think this fraction makes sense?” Students should have a variety of answers and it should lead to a valuable discussion about probability, and combinations.

Possible problems:
• Students may not list all possible combinations of seating arrangements.
• Students may accidentally list a sitting combination multiple times (having a double) and thus their resulting answer will be inaccurate.
• Students may not be responsible with the dolls, and thus they may not have the opportunity to work with them (these dolls are manipulatives and thus should be tried like manipulatives, with a purpose, and not as a toy).

Extensions:
• More “students” or dolls can be added to increase the difficult, “now there are 6 friends wanting to sit at the table, what are the new possible sitting arrangements?”
• Adding other conditions such as Frog needs to be seated to Tiger’s right.
• Giving Penguin and Bear fixed seats will decrease the amount of sitting arrangements, while still illustrating the same concepts/learning targets.

Concepts:
This activity is designed to show how modeling and theoretical probability can be used to solve compound event problems. Students can generate a list of all desired outcomes and divide that by the total possible outcomes. This lesson can also show how permutations can be used to find all possible outcomes.
Students will need to be able list and understand sample space, desired outcomes, and fractions.

Aspects of mathematical modeling:
1. Making assumptions and approximations to simplify a complicated situation.
3. Identify important quantities and organize their relationships using such tools as diagrams, two-way tables, graphs, flowcharts, and formulas.
4. Analyze those relationships mathematically to draw conclusions.
5. Interpret their mathematical results in the context of the situation and reflect on whether the results make sense.

Math Practices used:
1. Make sense of problems and persevere in solving them.
2. Model with mathematics.
3. Use appropriate tools strategically.
4.Reason abstractly and quantitatively.

Resources:
• https://www.illustrativemathematics.org/illustrations/885

7.G-Seattle Triangles

Standards:

CCSS.Math.Content.7.G.A.1

Solve problems involving scale drawings of geometric figures, including computing actual lengths and areas from a scale drawing and reproducing a scale drawing at a different scale.

CCSS.Math.Content.7.G.A.2

Draw (freehand, with ruler and protractor, and with technology) geometric shapes with given conditions. Focus on constructing triangles from three measures of angles or sides, noticing when the conditions determine a unique triangle, more than one triangle, or no triangle.

Practices:

CCSS.Math.Practice.MP1 Make sense of problems and persevere in solving them.

Mathematically proficient students start by explaining to themselves the meaning of a problem and looking for entry points to its solution. They analyze givens, constraints, relationships, and goals. They make conjectures about the form and meaning of the solution and plan a solution pathway rather than simply jumping into a solution attempt. They consider analogous problems, and try special cases and simpler forms of the original problem in order to gain insight into its solution. They monitor and evaluate their progress and change course if necessary. Older students might, depending on the context of the problem, transform algebraic expressions or change the viewing window on their graphing calculator to get the information they need. Mathematically proficient students can explain correspondences between equations, verbal descriptions, tables, and graphs or draw diagrams of important features and relationships, graph data, and search for regularity or trends. Younger students might rely on using concrete objects or pictures to help conceptualize and solve a problem. Mathematically proficient students check their answers to problems using a different method, and they continually ask themselves, “Does this make sense?” They can understand the approaches of others to solving complex problems and identify correspondences between different approaches.

In this lesson we will be using drawings of different types of triangles to determine how many different tourist locations we can attend on our field trip. In order to prepare the students for the upcoming field trip we decided it would relate well to our mathematics curriculum to investigate the triangles, and drawing of triangles under the conditions that we have made for the field trip. The conditions that we apply will be “can we travel the distance in the amount of time we have and still visit all of the locations on our itinerary”. Other conditions include:

  1. Type of triangle (scalene, obtuse, equilateral, isosceles, acute, right angle)
  2. Size of the legs, hypotenuse.
  3. Location the students need to travel.
  4. Time students have to travel a certain distance.
  5.  Amount of locations that can be visited to maximize the value of the field trip.

This lesson will model mathematics as more than just arithmetic – it is about problem solving.  Teaching mathematical modelling involves high-order thinking skills in representation of the real world, as well as skills of problem solving.  These are desirable outcomes that as important as getting the “right answers” to “problem sums”. By modeling this lesson in this format the students are engaged, because it is a trip they are going on. They get to make choices, and the lesson is hands on. Because the students are going to be “selling” their itinerary to the class, not only are they doing the work, but they will be explaining their thinking.

Questions to Present to Students:

Using the attached map, have students answer the following questions.

seattlemap (2)

Start at the ferry and from the ferry terminal walk west. The distance of the leg of our triangle is 10 cm (using the ruler given). If we draw an equilateral triangle for the itinerary how many places can we visit along our trip?

Start again at the ferry and walk west. Draw a new equilateral triangle that is 160% larger than your original triangle. With this larger triangle, how many places can we visit?

The class starts walking west from the ferry terminal to reach the Seattle Center. In order to head back to the ferry, what type of triangle would be best suited? (scalene) If you were to draw a scalene what would it look like on your map? What points of interest could you visit on the way back?

Draw an equilateral triangle from the ferry terminal to the Seattle Library.

What points of interest could the class visit if they we took this path?

Now try drawing an isosceles triangle from the ferry terminal to the Seattle Library.

Does this change the points of interest you can travel? How? Can you go to more places or fewer?

Maximizing the Lesson

What type of triangle would be used for the class to get the most educational, tourist, and entertainment options? Try scalene, acute, obtuse, right, and equilateral and consider which triangle if similar in size is best suited to visiting the most locations. Which triangle do you think will be the best? Why do you think this? Can you prove it?

How far can the class travel within 8 hours assuming most people walk at 4 mph(this requires students determine a scale, and the students will need to determine the distance units they will use? Hint: miles makes converting the distance a student can walk easily; otherwise more conversions need to be done)?

What type of triangle did the student draw? (Prompt students to explain their thinking at these points)

Allow students to make presentations to “sell” their tour itinerary.

Our class field trip has 8 hours to spend in Seattle. In order to get the most out of our field trip in the shortest amount of time, and the least amount of walking, draw a triangle that includes:

1 educational site

1 tourist site

1 entertainment site

Using the table given and the time constraint, determine the time it will take to travel to , and the amount of time each location will require to visit to get the most out of the itinerary.

Further Investigations:

Make predictions and determine the area of the triangles. Compare these to google maps to incorporate technology. Discuss whether the area is important for planning the itinerary. How is area going to be different than the perimeter? Which will be the most important for making decisions for the field trip? What about topography, how could this affect the itinerary? What about our model is good? What about our model doesn’t make sense? (Students should be able to determine that the city blocks are not triangles, so buildings may prevent walking in straight lines. What does that mean about our itinerary?


Point of Interest Time to Visit
Seattle University  35 minutes
Space Needle 30 minutes
Experience Music Project (EMP) 1 hour
Nordstrom 45 minutes
Seattle Art Museum 1 hour
Underground Tour 1 hour
Ye Olde Curiousity Shoppe 25 minutes
Seattle Aquarium 1 hour
Seattle Pacific University 30 minutes
Pike Place 25 minutes
Seattle Center 1 hour
Pacific Science Center 2 hours
International Fountain 15 minutes
Carousel 15 minutes
Safeco Pro Shop 20 minutes
Benaroya Hall 30 minutes
Seattle Library 45 minutes
Pirates Plunder Souvenirs 15 minutes
Tillicum Village 4 hours

– Eric Kress, Nicole Kraght

6.EE-Freezing Point Modeling & Experiment

Austin Anglesino, Mindy Howard, & Becca Edick                                    Math 486

 Freeze Point Depression Lab and Lesson Plan

a. objective list

Objectives: Students will be able to [See key below!]

knowledge claim

skill claim

know = K

do = D


D

1.

Make accurate measurements of liquids and solids.

K

2.

Name at least 2 temperature scales.

K

3.

State the components of the scientific method and Polya’s Problem Solving.

D

4.

Weigh materials on a scale.

D

5.

Read a thermometer and record temperature.

D

6.

Collect data in a simple scientific experiment.

D

7.

Record data values in a two-component (x, y) table and graph ordered pairs.

K

K

8.

9.

Recognize and/or define relevant terms.

Explain Colligative Properties.


CCSS Math Standard 6.EEC.9 Represent and analyze quantitative relationships between dependent and independent variables.

CCSS Math Practices

            Reasoning- Students are required to make sense of quantities and their relationships, consider units involved, and understand the meaning of quantities and variables in the problem.

            Use appropriate tools- Students are required to use appropriate tools including thermometers, beakers, and others within their grade level. Students can use these tools to deepen their understanding of the concepts involved.

Modeling is used to enhance student learning through an engaging video and a hands on experiment. This provides visuals and expands student learning as well as involves them in the scientific and mathematical processes. The experiment allows students to discover concepts throughout the lesson, as an inquiry based process.

b. materials list

Materials:

·         Ice

·         Water

·         Beakers

·         Thermometers

·         Salt

·         Sugar

·         Whole Milk

·         Vanilla

·         Whipping Cream

·         Plastic Bags

·         Salt Scooper

·         Weigh Boats

·         Scale

·         Alternative Milk Product-Soy milk or juice.


c. terms

Science

Temperature: a measurement of hotness and coldness

Measurement: assigning a numerical value to a physical or chemical property

Freezing Point Depression: lowering the freezing point by adding a solute to a solvent

Colligative Property: properties of solvents which are affected by the number of particles into which a solute separates when solute and solvent are mixed

Math

Ordered pair: a pair of numbers used to locate any point on a coordinate plane, example (–1, 3) where – 1 is on the x–axis and 3 is on the y–axis

Graph: a point or set of points representing ordered pairs

Dependent Variable: A variable (often denoted by y) whose value depends on that of another.

Independent Variable: A variable (often denoted by x) whose variation does not depend on that of another.

d. at least 3 preview questions

Preview Questions: (to be asked near beginning or lesson)

1.  What is the freezing point of water? (0 degrees Celsius, 32 degrees Fahrenheit)

2. What are the two scales we typically use for measuring temperature? (Fahrenheit and Celsius)

3. How can you raise or lower the freezing point of a liquid? (Yes. One way is by adding salt to the liquid)

e. anticipatory set/grabber

Show the following video: Youtube video.

http://www.youtube.com/watch?v=f9BzuMiQAZA

·         This video is more of a funny video to get the students’ attention. This video shows a “Salt and Ice Challenge” and demonstrates how cold ice can get with the addition of salt.

f. agenda/list of what will happen


1. Anticipatory Set: http://www.youtube.com/watch?v=f9BzuMiQAZA

2. Use the preview questions.

3. Provide the definitions of terms with examples. Have students read one at a time. (Key Terms Handout)

4. Students review problem solving steps and scientific method by reading the steps out loud.

Polya’s Four Step Problem Solving Plan

1.      Understand the problem

2.      Devise a plan

3.      Carry out the plan

4.      Look back

Scientific Method

1.      Identify and research problem

2.      Develop a hypothesis

3.      Design and conduct an experiment

4.      Analyze results

5.      Reflect on results and hypothesis to formulate conclusion

6.      Repeat process as needed


5. Demonstrate measurement techniques for data collection. Set up materials and describe experiment.

6. Students collect data and record on HANDOUT #1.

7. Present mini lesson on how to graph ordered pairs on a graph. (If Needed)

·         Students should do this on their worksheet if needed.

·         Draw graph on white board.

·         Ask students what scale to use on x-axis? (Should be 5gram intervals)

·         Ask students what scale to use on y-axis? (Varies depending on temperature used. Probably 5 degrees for Fahrenheit and 2 degrees for Celsius.)

·         Create a graph using these scales/intervals on the labeled axis.

·         Ask students to tell you some ordered pairs they got from their data.

·         Show students how to graph given these ordered pairs. (Example: given (10,-2). Find 10 on the x-axis, find -2 on the y-axis. Find point where these two meet and put a dot on graph.)

8. Students graph their temperature data on HANDOUT #1.

9.  Explain how to make Ice Cream. Leave directions up on PowerPoint.

10. Students make Ice Cream.

*        1 gallon Ziploc bag

*        2 cups ice

*        Salt (1/2 -3/4 cups)

*        1 quart Ziploc Bag

*        1/2 cup milk

*        1/2 cup whipping cream (heavy cream)

*        1/4 cup sugar

*        1/4 teaspoon vanilla


11. Discuss summary questions to wrap up the lesson.

12. Give students Assessment.


g. at least 3 wrap–up/oral assessment questions

Summary/oral assessment questions: (to be used near the end of the lesson)

1.      Do we see examples of freezing point depression in our everyday life? Where?

(Yes. Example: Salt on frozen sidewalk/road)

2.      Describe how the scientific method or Polya’s Problem Solving was used during this lesson. Were all parts used? If not, what was missing or changed?

(Answers may vary.  Most likely used all parts of Polya’s. For scientific method we didn’t get to research or make the experiment. Just conducted it one time.)

3.      What did you learn during this lesson?

(It is possible to lower freezing point of a liquid)

4.      What does the salt do in this experiment?

(Lowers the freezing point of a liquid)

5. How does the ice cream taste?


h. post lesson

Post Lesson

1.      Students take an individual assessment aligned to objectives, probably in their own classroom.


Freezing Point Depression Worksheet

Directions: Add increasing amounts of NaCl to the ice water solution and measure the temperature. (Make sure you use distilled water and always keep ice in your solution.)

What do you think will happen when adding salt to an ice water solution?

Hypothesis:

Procedure:

1.      Fill beaker with 150mL of water/ice mix. (Mostly ice)

2.      Measure and record temperature.

3.      Add 5 grams NaCl.

4.      Stir for 1-2 minutes and record temperature.

5.      Repeat process adding 5 grams of NaCl

6.      Stop when you find the temperature has quit changing.

Total Grams of NaCl

Temperature of Solution

(Celsius)

Temperature of Solution

(Fahrenheit)

0

5

Graph Your Results for Celsius Degrees

What is the control/independent variable? (X-axis)


What is the dependent variable? (Y-axis)


Graph Your Results for Fahrenheit De

6.EE.Matching game to increase students abilities to evaluate and solve numerical expressions

Common Core Standards:

 6.EE.A.1 – Write and evaluate numerical expressions involving whole-number exponents.

6.EE.A.2 – Write, read, and evaluate expressions in which letters stand for numbers

2.A – Write expressions that record operations with numbers and with letters standing for numbers. For example, express the calculation “Subtract y from 5” as 5-y.

2.B – Identify parts of an expression using mathematical terms (sum, term, product, factor, quotient, coefficient); view one or more parts of an expression as a single entity. For example, describe the expression 2(8+7) as a product of two factors; view (8+7) as both a single entity and a sum of two terms.

2.C – Evaluate expressions at specific values of their variables. Include expressions that arise from formulas used in real-world problems. Perform arithmetic operations, including those involving whole-number exponents, in the conventional order when there are no parentheses to specify a particular order (Order of Operations). For example, use the formulas V=s^3 and A=6s^2 to find the volume and surface area of a cube with sides of lengths s=1/2.

6.EE.A.3 – Apply properties of operations to generate equivalent expressions. For example, apply the distributive property to the expression 3(2+x) to produce the equivalent expression 6+3x; apply the distributive property to the expression 24x+18y to produce the equivalent expression 6(4x+3y); apply properties of operations to y+y+y to produce the equivalent expression 3y.

6.EE.A.4 – Identify when two expressions are equivalent (i.e., when the two expressions name the same number regardless of which value is substituted into them). For example, the expressions y+y+y and 3y are equivalent because they name the same number regardless of which number y stands for.


Description of the Activity:

The game is a modified version of the classic card matching game, “Concentration.” Just like “Concentration,” our matching game requires players to match cards; however, instead of looking for cards with the same image, the players in our game will be asked to turn over one card – an “Equation Card” – and solve the equation. Then, the players match the Equation Card to a number that is hidden behind an “Answer Card.” For example:

A player flips over an Equation Card and sees the following equation: 3x + 4 = 10

On a sheet of paper, the player solves the equation, and he or she must show his or her work. The student solves for “x” and finds that the answer is 2.

After the player has solved the equation, he or she tries to find the card with the number 2 on it. If the player finds the match, he or she is allowed to keep the pair (the Equation Card and Answer Card) of cards and that player can continue to flip over cards until he or she answers incorrectly or a match is not found. If the player solves the equation card but cannot find the matching Answer Card, the cards are turned back over and the player does not keep the pair of cards.

The player who is the oldest takes the first turn, and the game ends when all cards have been collected. The player with the most correctly matched pairs wins.

All cards in the game will have a number on them, and while showing their work on their paper, the players will be asked to identify the number on the Equation Card. When they find the matching answer on the Answer Card, the players will need to identify the number on the matching Answer Card. For example, a player’s sheet of paper should look like the following:


Equation Card Number

Equation

Answer

Answer Card Number


4

3x + 4 = 10

     – 4    -4

3x = 6

3     3

x = 2

X = 2

10

Identify CCSS Mathematical Practices:

Our game requires our students to use multiple mathematical practices. The first practice is “Deductive and Quantitative Reasoning.” Students will use deductive and quantitative reasoning in order to determine the accuracy of the answers that they give. The answers that the students generate through working through the problem on the Equation Card should make sense; therefore, it should be easy for a student to prove his or her answer is correct. Students should be able to state and defend their answers by using mathematical terminology and logic in applying their answer to the original problem. By being able to use logic and mathematical terminology in defending their answer, students will be able to demonstrate their ability to use the mathematical practice, “Logical Argument.”

Students will also use the mathematical practice, “Modeling,” by filling out tables in their worksheets, making assumptions by claiming an answer to be true, looking for revision and analyzing the answers’ relationship to the equation by challenging each other’s answers, and reflect on their answers. By using modeling in these ways, students will be able to see how they solved the equation, and they will be able to identify how they solved the problem and if their thinking makes sense. Reflecting on their work allows students to identify problem areas, and it also makes it easier for the teacher to give useful and timely feedback.

Students will also be able to use and develop their “Structure” and “Related Patterns” practices. Students will be afforded the opportunity to sharpen their skills in these practices during the game because they need to look for mathematical patterns and evaluate the structure of the problems on the Equation Cards. In order to correctly solve and understand the equations, noticing the structure and patterns in a problem helps the students increase the speed in solving the problem and their overall understanding of how the parts of the equations work together to provide an answer.


How Modeling Enhances teaching effectiveness

This model enhances the teaching effectiveness by giving the students something other than a worksheet to review the Expressions and Equations unit of the common core state standards. Because students can work in small groups or pairs, the assessment activity becomes less stressful for the students, and they become more engaged. The activity presents a challenge to the students, but is designed to immediately show the student if their answer is correct. This also allows time for the teachers walk around the class and get a good view of how the students are doing with the current material; this can help them decide if re-teaching is necessary. Because the students can get credit for turning in their work, it gives students who are hard to get engaged incentive to participate.

Other ways to use this activity

This activity can target nearly any common core standard, though this particular game was designed as a review of the 6th grade Expression and Equations standards. You could easily design your own version of the game for any grade level, for any concept in any content area.

This game is easily manipulated to fit your classroom needs.

As the matching game is fun and engaging, teachers can assign this activity as a pre-assessment to determine prior knowledge, post assessment to decide if re-teaching is necessary, practice a difficult concept, and/or as a review of a unit, concept, or end of year. This would be an excellent way to practice for larger state exams as well.

This game can be turned around to where the students are making the matching game themselves—getting the practice or review while making the game—then the game is played by another team or pair—getting further practice or review. This would allow students to learn from and teach each other, and be more excited about the activity.