Review for HS Algebra Graphing Learning Progression (Review of CCSS for 7 & 8)

graphing picture


This learning progression is for an Algebra class for 9th grade students. There are five lessons in the progression. The content includes introducing students to graphing and what forms of functions they may come across when evaluating linear functions. It starts with a fun worksheet on plotting points it introduce the students to the coordinate system and the four quadrants. Then the progression transitions to the concept of slope and how to find it using two points by using a worksheet to assess. After that, point-slope and slope-intercept form are included and is the first time the students will be graphing a linear equation. Lastly, there is a full lesson plan on parallel and perpendicular lines in the math program Geogebra. It is an interactive activity which includes a overview of the material that is gone over in the learning progression, which solidifies prior content knowledge for the students. For a full preview of the learning progression as well as sections of the lessons activities visit the link below.

499E Learning Progresson Format


F-BF 3-Act Math: Pyramid of Pennies

Use a 3-Acts task to engage your students in building functions.

Common Core State Standards:

3.MD.7: Measurement & Data, Geometric measurement: understand concepts of area and relate area to multiplication and to addition.

F-BF.1: Functions, Building Functions: Build a function that models a relationship between two quantities.

Learning Target: I will be able to build a function to solve for the volume of a square pyramid.

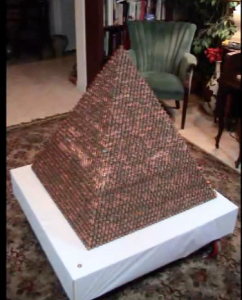
The Pyramid of Pennies problem can be found on the Dan Meyer’s 3-Act Math task website. This problem asks the students to determine how many pennies it takes to build the pyramid. It includes a 26 second video on the process of building the pyramid.

Pyramid of Pennies: http://mrmeyer.com/threeacts/pyramidofpennies/

Act 1:

The students will watch the video first to get a better idea of how many layers there are in the pyramid. The students are then prompted with the following questions:


pennypyramid1. How many pennies are there?

2. Guess as close as you can.

3. Give an answer you know is too high.

4. Give an answer you know is too low.


Before proceeding to act 2, I will ask my students what information is needed to find the amount of pennies used in the pyramid.

Act 2:

After the students had made an educated guess about how many pennies the pyramid is made of they will move on to learn some more information about the structure.

5. What information will you need to know to solve the problem?

They are shown 3 images about the base layer of the pyramid. In the first image, the base of the pyramid dimensions is 40 by 40 pennies. In the second picture, a single stack of pennies has 13 pennies in it.  In the third image, the picture shows the dimensions of a single penny. There is also a link that takes the students to a Wikipedia page that tells them how to find the area of a square pyramid.

Act 3:

The students learn the answer to the Pyramid of Pennies problem as well as get to see the newspaper clipping to the construction of the pyramid.

The students will obtain the learning target by seeing the construction of the pyramid and using all of the given information. The students will first need to set up an equation to find out how many pennies make up the base of the pyramid and how the next levels of the pyramid change as the structure grows. The students can create their own formula to determine the amount of pennies by using variables and the given information. In Act 2 the students will be able to adjust their original guess to an answer that comes from a generated formula. The students will be assess with the follow up questions at the end of the Pyramid of Pennies activity. The questions are harder

6. I have $1,000,000.00 in pennies, how big of a pyramid can I make?

7. Each stack has 13 pennies which is a strange number to choose. Why do you think Marcelo Bezos chose it? [Hint: not out of an abundance of superstition.]

8. Bezos says he can tell you the number of pennies in a pyramid with this equation:

where s is the number of pennies in a stack and b is the number of pennies on one side of the square base of the pyramid. Does this work? If so, prove it.

9. The Wheat and the Chessboard problem.

10. Give groups of students a dollar in pennies. See how fast they can assemble seven stacks of thirteen pennies. Then ask them to use that as a sample to determine how long it would take them to build the entire pyramid.

11. If Bezos now wanted to add more levels to the pyramid, what’s the best way for him to do that?

12. How heavy is the pyramid?

This activity is great for students because it is a really simple idea. One way that the students can be engaged is to have them measure the dimensions of the penny on their own and record their findings. The students will work in groups to complete this activity in the computer lab where they will be able to use technology view the video and images.

6.SP – Staying Healthy

Using Heart Rate Monitors and Speed Radars during Exercise

In this activity the students will be doing a series of exercises to monitor their heart rate, speed, and amount of exercise to calculate mean, median, mode, and distance. We want to find out if the class as a whole is in the healthy range for their sex and age group. The equipment needed for this activity is heart rate monitors, speed radars, and timers. The students will be split into groups for the different stations. The stations include a running station, jump rope station, and a sit up station. Each student will be wearing their own heart rate monitor. Within these groups the students will find a partner to measure all of their exercises using timers and the Sport Radar. The students will need one timer per pair, one Sport Radar for the running group, 10 jump ropes, and materials to record their information.

The Common Core State Standards that this activity measures are:

Grade 6:

Building on and reinforcing their understanding of number, students begin to develop their ability to think statistically. Students recognize that a data distribution may not have a definite center and that different ways to measure center yield different values. The median measures center in the sense that it is roughly the middle value. The mean measures center in the sense that it is the value that each data point would take on if the total of the data values were redistributed equally, and also in the sense that it is a balance point. Students recognize that a measure of variability (interquartile range or mean absolute deviation) can also be useful for summarizing data because two very different sets of data can have the same mean and median yet be distinguished by their variability.

 CCSS.MATH.CONTENT.6.SP.B.5.C
Giving quantitative measures of center (median and/or mean) and variability (interquartile range and/or mean absolute deviation), as well as describing any overall pattern and any striking deviations from the overall pattern with reference to the context in which the data were gathered.

High School Functions

In school mathematics, functions usually have numerical inputs and outputs and are often defined by an algebraic expression. For example, the time in hours it takes for a car to drive 100 miles is a function of the car’s speed in miles per hour,v; the rule T(v) = 100/v expresses this relationship algebraically and defines a function whose name is T.

The SKLZ Sport Radar can be found at Wal-Mart or:

http://www.walmart.com/ip/21666148?wmlspartner=wlpa&selectedSellerId=0&adid=22222222227015962974&wl0=&wl1=g&wl2=c&wl3=45286948592&wl4=&wl5=pla&wl6=88657884032&veh=sem

sport radar

This piece of technology costs $19.00-$45.00. In this group, Group 1, the students will use the speed radars to measure their speed for running 200 feet. They will then be asked to calculate their time in which they ran the distance and compare it to what their partners clocked for them. The students will record their time, heart rate, and speed. This information will be used at the end of the lesson for the classes mean, median, and mode for all of the stations.

The Polar Heart Rate Monitor can be found at Best Buy or:

http://www.bestbuy.com/site/polar-ft1-heart-rate-monitor-black/1170016.p?id=1218283545033&skuId=1170016&ref=06&loc=01&ci_src=14110944&ci_sku=1170016&extensionType=pla:g&s_kwcid=PTC!pla!!!80032725394!g!!40885790194&kpid=1170016&k_clickid=337686b8-31e5-9828-b301-000054d96bf6&kpid=1170016&lsft=ref:212,loc:1&ksid=337686b8-31e5-9828-b301-000054d96bf6&ksprof_id=9&ksaffcode=3252&ksdevice=c&gclid=CJaz0rupqMICFcZbfgodYS0A_A

heart rate watch

The Polar Heart Rate Monitor costs $36.99. Each student will wear these watches to measure their heart rate during their activity at all of the stations.

In Group 2 the students will be jump roping for 30 seconds. The partner who is not participating will count how many jumps the student successfully completes. After the 30 seconds the student will record their heart rate and amount of jumps they did.

In Group 3 the students will be doing sit ups for 30 seconds. The partner who is not participating will count how many sit-ups the student successfully completes as well as hold their feet. After the 30 seconds the student will record their heart rate and amount of sit-ups they did.

Once every student has finished with all of the activities, they will need to compile all of their recording with the rest of the other students’ numbers. On the excel spread sheet the students will write down their times, speeds, and numbers for all of the stations based on sex. The information will be anominous so that the students will not be criticized on their scores. After all the information is written down, copies will be made and distributed to all of the students to find the mean, median, and mode of all the categories. As a class we will find out if the students are in the healthy range for their sex and age group according to the CDC. The boys will calculate the boys excel spreadsheet and the girls will calculate their own. Teachers could also have the students graph the numbers to observe the bell curve.

Excel spreadsheet: Math 325 Heart Rate Monitors

7.EE-Calculating Wages and Tips

 7.EE-Solve multi-step real-life and mathematical problems

Algebra:

CCSS.MATH.CONTENT.7.EE.B.3
Solve multi-step real-life and mathematical problems posed with positive and negative rational numbers in any form (whole numbers, fractions, and decimals), using tools strategically. Apply properties of operations to calculate with numbers in any form; convert between forms as appropriate; and assess the reasonableness of answers using mental computation and estimation strategies.

Problem:

Joe works at a concessions stand at Century Link Field. Joe makes $10 per hour plus any tips he gets from the generous football fans. Set up and solve an equation for EACH of the given problems and write your answer using complete sentences.

  1. Set up a general equation for the total amount of money Joe will earn working at the concessions stand. Define your variables.
  2. How much money does Joe make if he works 4 hours and makes $17 in tips?
  3. If Joe makes $86 dollars total, and earned $31 dollars in tips, how many hours did he work?
  4. Joe worked with Steve during the Seahawk v. 49ers game. They worked 6 hours and made $46 in tips together. If Steve and Joe split the tips evenly, how much money did Joe make during that game?

Commentary:

The purpose of this problem is to illustrate the Common Core State Standard of applying a real-world situation to learning how to set up and solve single variable equations. The students learned how to manipulate one and multi-step equations. Teachers can use this problem as a summative assessment. This problem gives them the chance to reason how to set up an equation using information that is provided for them. Students are able to define variables for an equation and use values to evaluate for the unknown variables. The students use the additive and multiplicative inverses to further their mathematical understanding of solving equations. The students will get a chance to change an equation so that it fits what a question is asking. For example, changing the original equation from T=10x+y to T=10x+(y/2) to factor in the tips being split. The story problem has multiple parts, so this gives the students the opportunity to read and follow directions carefully.

Solution:

  1. Let x be the number of hours that Joe worked, let y be the number of tips in dollars, and let T be the total number Joe earned in dollars. The student can pick any variable for the given information but the equation must be set up in the correct order. The number of hours worked must be multiplied by the wage, so 10x. Then the tips will be added to that making the entire equation T=10x+y.

x= number of hours worked

y= number of tips earned in dollars

T= total number dollars earned

T=10x+y

2. The number of tips, $17, should be plugged into y for the given equation.

T=10x+17

Then since we know that Joe worked for 4 hours, we can evaluate when x=4.

T=10(4)+17

T=40+17

T=57

            Joe earned $57 total.

3. The total number of money that Joe earned was $86 dollars and his tips were $31. For the equation the students must evaluate when T = 86 and y = 31. Then the students must solve the equation for x.

86=10x+31

55=10x

5.5=x

Joe worked for 5 and a half hours.

4. Since the amount of tips earned were shared by 2 people, the total number of tips needs to be divided by 2 to find Joe’s share.

T=10x+(y/2)

            Then evaluate the equation when x = 6 and y = 46.

T=10(6)+((46)/2)

T=60+23

T=83

            Joe earned $83 total.


5.MD-Picture Problem: Predicting and Calculating Volume

 Many Too Many Small Boxes and Maru 2

Video found at: https://www.youtube.com/watch?v=Am3NVGP9rkQ

This video shows 4 different sized boxes and a cat, Maru, who tries to fit inside them. The video presents a “competition” between the boxes and which one the cat ends up choosing as his favorite. The math problem that I would present would be to ask the students to predict the sizes of the boxes. They would list the boxes they thought was the smallest to the largest. The students would also predict which box they think Maru will choose in the end; extra credit for the students who choose correctly. The students would measure the screen on the computer to find  the height, length, and width of each box. Then they would solve for the volume for the 4 boxes. After everyone has found the volume the teacher would play the video to the end for the students to see the outcome.

CCSS.MATH.CONTENT.5.MD.C.5.B
Apply the formulas V = l × w × h and V = b × h for rectangular prisms to find volumes of right rectangular prisms with whole-number edge lengths in the context of solving real world and mathematical problems.

G.GPE-Using Geogebra to Learn About Lines

parallel linesperpendicluar lines


In this lesson students will learn to model perpendicular and parallel lines in the mathematical program Geogebra. The students have been learning how to graph linear equations by finding the slope and y-intercept of an equation. They are able to then use this information to graph the line by hand. Following this lesson the students will get the chance to work in the computer lab on the Geogebra program. The students know about the characteristics of perpendicular and parallel lines but they have not gotten the opportunity to graph them on the same coordinate system.

The Geogebra program will help the students graph linear equations more easily than they would drawing it by hand. The students have the ability to manipulate the points and slope more easily than if they were working on paper.  Since it takes less time to graph the equations the students have the opportunity to make connections sooner. Geogebra helps the students to visualize the graphical representations of lines in relation to the properties that the equation is showing them.  Not only will they be able to explain their reasoning from an equation, but from a graph as well.

Math 325 Modeling Technology Lesson 

Perpendicular and Parallel Lines answer key

Perpendicular and Parallel Lines worksheet

S.ID-Using a Smart Board for Interactive Warm-Up Activities

Smart BoardThe following article summarizes how to use a Smart Board for fun warm-up activities. A Smart Board is an interactive white board that projects images onto a screen that can be written right on to. The Smart Board is also a touch screen that can have the computer images and online applications. The Whack-A-Mole application used in the article is found on the Smart Exchange website. Teachers can use Whack-A-Mole for review activities, warm-ups, or for participation based group work. It is a great assessment tool to see if the student are meeting the Common Core State Standards and learning objectives. The teacher is able to decide whether to move on to new lessons or to reevaluate old material. It gives the students a change of pace rather than working from the book or worksheets.

Teachers can find many free programs on the Smart Exchange website. The Smart Board comes with colored pens that are used specifically for the technology. The Smart Board has many applications such as  graphing calculators, geometrical models, and a variety of mathematical problems for students to work on. Overall the Smart Board technology creates for easier access to resources allowing more time for learning and pedagogy.

Math 325 Technology Article