Let’s Head for the Hills 6.EE.C

With hiking season right around the corner, your friends and you decide to plan a backpacking trip to a lake. During the planning process, you want to figure out how long it will take to hike the trail to your camping destination. By doing some investigative research, you are able to find a map of the trail with descriptions of the various inclines along the trail. Using your mathematical and problem solving skills, find out how long it will take you hike each part of the trail based on the incline and speed of travel to answer the ultimate question of how long it will take your friends and you to reach the camping destination at the end of the trail.

This lesson is geared for students to work in groups in determining the speed of travel along the various slopes of the trail. Students must use their mathematical reasoning and problem solving skills to calculate and solve this problem. Students can use a particular hiking trail of interest or the teacher can assign ones to the class.

This lesson is focusing on the CCSS.Math.6.EE.C.9- Use variables to represent two quantities in a real-world problem that change in relationship to one another; write an equation to express one quantity, thought of as the dependent variable, in terms of the other quantity, thought of as the independent variable. Analyze the relationship between the dependent and independent variables using graphs and tables, and relate these to the equation.

School Presidential Election 7.SP.A

School Presidential Elections

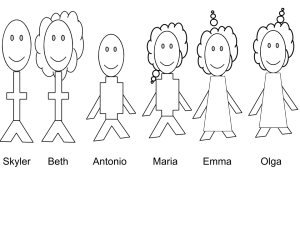
The students are learning about probabilities in math so they will apply these concepts to a real life event that happens every year in schools across our nation.This sample picture has so much meaning to all the students in the entire 7th grade class as it is about school culture. There is a number of probability activities this simple picture can expand to using mathematical practices as to who will win the election. Activities like: Will it be a girl or boy? Will it be the popular student or the student that delivers the best speech? Based on a mini session of class voting, will it be an accurate representation of the actual event?  For this particular activity there is a total of 6 students in the running for class president, 2 boys and 4 girls. The students will use red poker chips for the girls and blue poker chips for the boys as well as a randomization holder (paper bag). This process will help determine whether a girl or boy will be president based on some fun probability activities (SEE HANDOUT ATTACHMENT). The students will also explain as to what parts of the activity are empirical or theoretical and why as well as learn the Law of Large Numbers. This activity aligns with CCSS.MATH.CONTENT.7.SP.A.1 & 2

PictureProblemActivity

Interpreting the cross-sections of 3-dimensional objects: HSG-GMD.B.4

Image result for object cut in half


HSG-GMD.B.4 has to do with a student’s ability to visualize relationships between 2 and 3 dimensional objects. Given the example above you see that a 3-dimensional sphere is related to a 2-dimensional circle. This relation is this; a circle is the cross-section of a sphere. No matter where or at what angle you take the cross-section it will be a circle and not matter the size of the sphere is will be a circle as seen by the rings in the cross-section. This could be better represented with 3 spheres cut in different places showing that the resulting cross-section is always a circle.

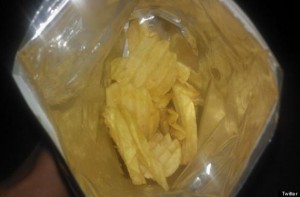
Picture Problem: Potato Chips

o-CRISPS-570 p0376182 potato-chip-taste-test_612


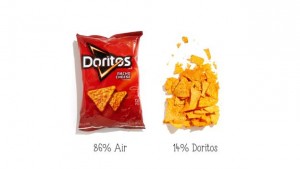
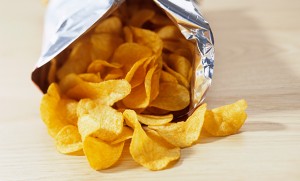
People are often frustrated with the amount of chips that come in a bag of chips. Or lack thereof.

For this activity, students will find out the average amount of chips found in bags of chips. They will then find the average size of a chip, and the amount of space that a chip bag can hold. From there, they will figure out how many chips could fit in bags if companies filled them up, and compare that to how many they actually put in the bag.

Example: Lays potato chips. Out of x amount of bags, they hold an average of y amount of chips, filling z% of the bag. Therefore, if they filled the bag, they could fit a amount of chips.


They could complete this through proportions

CCSS.MATH.CONTENT.7.RP.A.3
Use proportional relationships to solve multistep ratio and percent problems.

or geometry, using surface area and volume

CCSS.MATH.CONTENT.7.G.B.6
Solve real-world and mathematical problems involving area, volume and surface area of two- and three-dimensional objects composed of triangles, quadrilaterals, polygons, cubes, and right prisms.

Where do your movies plot? CCSS.Math.Content.6.SP.B.4.

Where do your movies plot?

Star_Wars

In the United States we are living a society that is strongly influenced by pop culture. Trends come and go but during that short period of time students inundate the hallways with those trends. For example, throughout the month of December of 2015 students were all wearing Star Wars attire. The reason behind it was Star Wars The Force Awakens. If pop culture is so influential, then why not integrate it into our teaching? The activity I have in mind incorporates movies and their box office earning to teach students the CCSS.Math.Content.6.SP.B.4. Display numerical data in plots on a number line, including dot plots, histograms, and box plots. In the activity the students will be given a list of the top 100 record breaking box office earning in America (with out their respected earnings). The link is given below. To make this activity more relevant for the students the will have to choose their top 10 movies from the given list. The students will then graph their data on a number line, including dot plots, histograms, and box plots. The students will have many opportunities to use technology. The teacher can allow students time to research their top ten movie’s earnings and then graph their data using other tech resources such as Excel. At the end students can present and discuss their graphic representations of their data.

the-numbers.com/movie/records/All-Time-Worldwide-Box-Office

MTV Math

MTV MATH

mtv

All middle school students enjoy listening to music in some way or another, if teachers can connect student interests into their lessons, such as music, the students are more likely to be engaged and excited to learn math. One example of this is by incorporating the Top 40 hit music into a 6th grade statistic lesson.

Students would be given a table with the top fifteen Top 40 music hits including the song title, the artists, and the length of the song. Students will need to organize the data and then use the data to find the mean, median, and mode of the data set. If desired teachers can also use this data to find five number summaries as well as the interquartile range and possible outliers. This falls under the 6th grade Common Core State Standard of CCSS.Math.Content.6.SP.B.5.c. This activity is engaging for 6th grade students because it pertains to their interests and teaches math in an exciting way while connecting to teen culture.

If wanted, this activity can be connected to other subject areas such as any music classes. Connections can be made between music history as well as music and today’s media. Students in music class can also study different musical genres and learn about radio editing.

M&M’s

M&M’s


P

All middle school students love M&M’s! All middle school students love engaging lessons. Why not combine them to make a lesson your students will never forget?

Ask your students the big, important question at the beginning so they know what they’re focusing on: How many M&M’s will fit in a gallon jug? Have the students discuss the question for a few minutes with their classmates, then have each student guess how many will fit in the jug. Depending on your classroom, you could have them right their guesses on a piece of paper or on the whiteboard.

Students will get into pairs and each group will fill a graduated cylinder with 50mL of water, then add 10 M&M’s into the graduated cylinder. After a quick calculation, they will find out how many mL are “equivalent” to 10 M&M’s. Students will need to convert mL to gallons, then mathematically find out how many M&M’s will fit into a gallon jug.

Have each group add their M&M’s into the empty jug. The students can count and continue to add them into the jug making sure to keep track how many are in there. Once the jug is full, the class will find their answer. As a class, compare this number to their guesses to see who was the closest.

CCSS.MATH.CONTENT.6.RP.A.3.D
Use ratio reasoning to convert measurement units; manipulate and transform units appropriately when multiplying or dividing quantities.

HSG.GMD.A.3-Rolls of Hay on the Farm

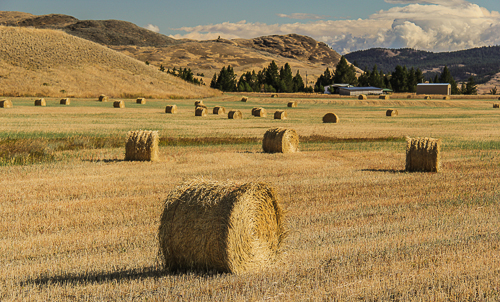
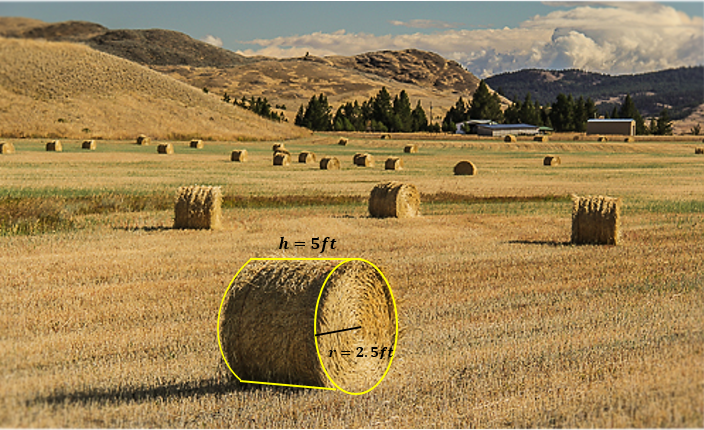
The object that should be the main focus in the picture is the roll of hay that is seen in closer to you. This picture is usually seen in a rural area where farmers are creating the hay in the roll of hay. However, some students have have seen bails of hay that are rectangular instead in a cylinder shape. This picture may ignite motivation in students to complete a problem that has to do with agriculture of this type because it deals with a real world situation and they live in an area that have hay farms.

When viewing the picture below, all the students see are rolls of hay in a field of grass.

hay-rolls-5

(Picture was found at: https://rprtphoto.wordpress.com/tag/bale/)

The problem that the students will focus on is finding the volume of one roll of hay given specific measurements where height is 5 ft and the radius is 2.5 ft. View the picture below. The students will need to know the volume of a cylinder in order to do the problem. Moreover, this problem is aligned to the Common Core Standard: CCSS.MATH.CONTENT.HSG.GMD.A.3: Use volume formulas for cylinders, pyramids, cones, and spheres to solve problems.*

Hay bails

In addition, if a teacher wanted to extend the problem of calculating the volume of one roll of hay, the teacher can have the students solve different heights and radius of rolls of hay and solve which size of hay is the better buy for the money. Or the teacher can ask: “How many rolls of hay can fit on a hay trailer that is 6 and half feet in width and 37 and half feet in length?” The students will need to use the width (height) and the diameter in order to see how many can fit on the hay trailer.