CCSS.Math.Content.HSA.REI.D.10
Sometimes it can be difficult as educators to create projects that model and relate mathematical concepts to everyday life. It is extremely easy and most every teacher is guilty of at some point throughout finding themselves in a creative rut when it comes to planning lessons. The following activity is one that is both relevant in that it involves a real life scenario and it is also relevant in that it uses Vernier technology to capture wind or air speed to collect data.
What You Will Need
For the following project, teachers must obtain the following materials.
TI-84 Calculators (enough for every group in the class)
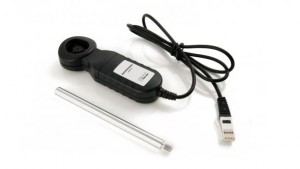
Anemometers, one for each calculator
Vernier EasyLink, one for each calculator
Worksheet
(All Vernier equipment may be located, researched, and bought online at http://www.vernier.com/products)
The Air Speed Project
This project requires students to combine into groups of three or four (preferably three). Each group will gather and set up the Vernier Anemometers, EasyLink, graphing calculator, and worksheet. Then, depending on the weather, students will either go outside to begin collecting their data, or they will remain inside and use their breath in such a way that can replicate wind speed. Students will be asked to collect three different sets of data representing wind speed over a set time period of 10 seconds. The groups will then represent their findings graphically using the graphing calculator and transfer the information and picture to the worksheet. The next step in the project requires students to use the TI-84 calculators to find the equation of a parabola/linear equation that best describes the data. If students are able to collect wind speed a linear function will probably best fit the data, and if each student is taking turns blowing into the anemometer, a parabola will most likely fit the date best. The final step in this project is for students to compare and contrast their data with the equations they found. In their groups, students will write down their findings, and then the class will come together a whole and discuss the discoveries that were made during the project.
Adaptability
There are many ways in which educators may alter the given project to meet their specific classroom’s needs. If budget is an issue or there is simply not enough time to collect all the necessary materials, teachers could use one anemometer and EasyLink to gather data for the entire class. The data could be gathered in class or the teacher could gather data before class and simply demonstrate how he used the technology in front of the class. Once students have the data, they would split into groups and input each data set into their calculators manually and continue completing the worksheet. If the number of calculators is an issue, this project could also be conducted by the teacher with the graphing calculator being projected for the students to see using a Doc Camera. The students could then follow along and fill out the worksheet individually or in groups.


