HS.F.IF.A.1 Finding the Domain of a Given Function

Alignment to Content Standards:

CCSS.Math.Content.HSF.IF.A.1
Understand that a function from one set (called the domain) to another set (called the range) assigns to each element of the domain exactly one element of the range. If f is a function and x is an element of its domain, then f(x) denotes the output of f corresponding to the input x. The graph of f is the graph of the equation y = f(x).


Task:

Given the function,

Screen Shot 2015-11-23 at 8.51.38 PM


  1. Find solutions for f(9) and f(5), and show your work writing out every step.


  1. Explain your steps from solving the function for each of the above x-values and list the operations used. Explain any restrictions that resulted from solving f(9) and f(5).


  1. Give a possible domain for f(x).


The commentary and solution for the above task can be found in the document attached below.

IM Assessment_MA325


The Leaning Tower of Pisa! -HSG.SRT.C.8

The Tower of Pisa: such a mystery to so many students who do not yet have the understanding of how and why the famous tower leans to one side the way that it does. Why does it lean? Was it originally designed to lean? What keeps it from falling over? How far does it lean? Is it possible to still walk inside the tower or is the slope of it’s floors too drastic? All these questions could be used in the classroom to introduce a problem that students will solve through the exploration of the tower. Some students will have the opportunity to one day visit this historical site through study abroad trips or family vacations and will be lucky enough to see this wondrous man made phenomena first hand, but for many what they learn in the classroom and bother to research on their own will be all they know about the historical phenomena.

Leaning-Tower-of-Pisa-Excerpt

In the context of the classroom, the Tower of Pisa supplies teachers with a real world example from which numerous mathematical problems and calculations can be derived. Among the many problems a teacher can present for students to solve which align with the Common Core State Standards is the problem of finding the angle at which the tower leans. This can be calculated by creating a right triangle from the top of the tower closest to the ground, to the ground, and then across to the base of the tower. Knowing that the created triangle is a right triangle and the given measurements of two sides of that triangle, students can then apply the Pythagorean Theorem to find the angle at which the tower leans.

30_q_a

Using real life and fascinating architectural phenomena such as the Leaning Tower of Pisa can be a wonderful tool to help educators engage and catch the attention of students who as a class hold a wide variety of interests. Students who are planning on seeing the structures in future travels will be interested in learning about it, and students interested in art, architecture, or engineering will find the physical attributes of the tower fascinating. For most students, however, the fact that the tower is a real, historical place in the world will be enough to stir in them the interest and desire to learn more about the leaning tower’s story.

Harnessing the Power of the Wind!

CCSS.Math.Content.HSA.REI.D.10

wind-turbines17

Sometimes it can be difficult as educators to create projects that model and relate mathematical concepts to everyday life. It is extremely easy and most every teacher is guilty of at some point throughout finding themselves in a creative rut when it comes to planning lessons. The following activity is one that is both relevant in that it involves a real life scenario and it is also relevant in that it uses Vernier technology to capture wind or air speed to collect data.


What You Will Need

For the following project, teachers must obtain the following materials.

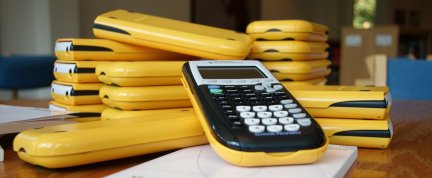
TI-84 Calculators (enough for every group in the class)

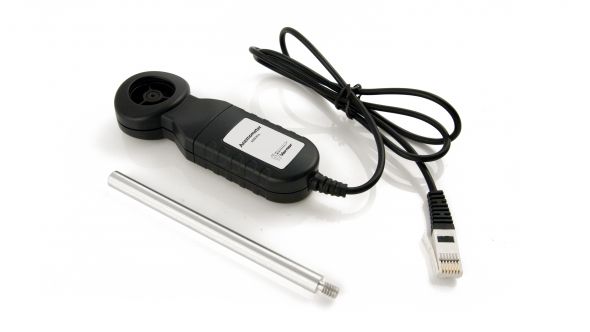
Anemometers, one for each calculator

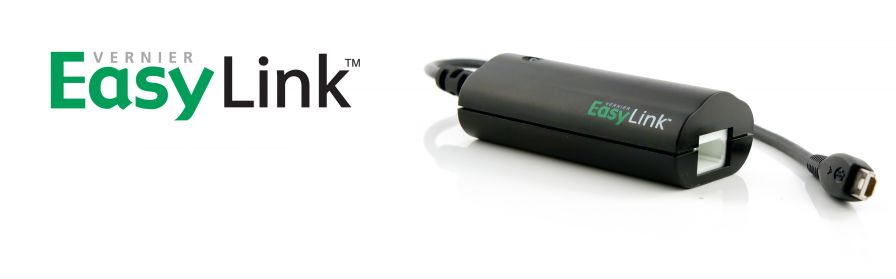
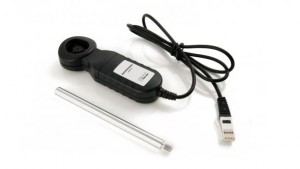
Vernier EasyLink, one for each calculator

Worksheet

(All Vernier equipment may be located, researched, and bought online at http://www.vernier.com/products)

verniereasylink


The Air Speed Project

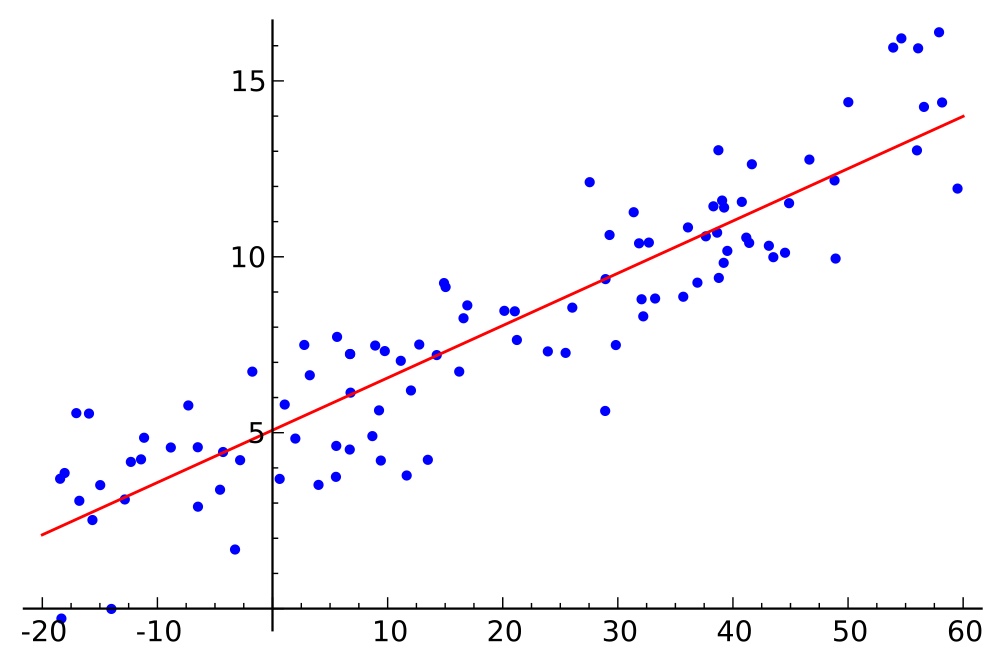
This project requires students to combine into groups of three or four (preferably three). Each group will gather and set up the Vernier Anemometers, EasyLink, graphing calculator, and worksheet. Then, depending on the weather, students will either go outside to begin collecting their data, or they will remain inside and use their breath in such a way that can replicate wind speed. Students will be asked to collect three different sets of data representing wind speed over a set time period of 10 seconds. The groups will then represent their findings graphically using the graphing calculator and transfer the information and picture to the worksheet. The next step in the project requires students to use the TI-84 calculators to find the equation of a parabola/linear equation that best describes the data. If students are able to collect wind speed a linear function will probably best fit the data, and if each student is taking turns blowing into the anemometer, a parabola will most likely fit the date best. The final step in this project is for students to compare and contrast their data with the equations they found. In their groups, students will write down their findings, and then the class will come together a whole and discuss the discoveries that were made during the project.

Adaptability

There are many ways in which educators may alter the given project to meet their specific classroom’s needs. If budget is an issue or there is simply not enough time to collect all the necessary materials, teachers could use one anemometer and EasyLink to gather data for the entire class. The data could be gathered in class or the teacher could gather data before class and simply demonstrate how he used the technology in front of the class. Once students have the data, they would split into groups and input each data set into their calculators manually and continue completing the worksheet. If the number of calculators is an issue, this project could also be conducted by the teacher with the graphing calculator being projected for the students to see using a Doc Camera. The students could then follow along and fill out the worksheet individually or in groups.

AirSpeedWS

CCSS.Math.Content.HSS.ID.B.6 Making Linear Regressions Relevant in the Classroom

resize_image

A question that teachers are constantly asking themselves is how to make math topics relevant in the eyes of their students. And since it seems that the higher levels of math being taught, the less of an issue this seems to be, this issue of relevancy is extremely common in Algebra I and Algebra II classes. Many students have a difficult time relating variables, equations, and algebraic concepts to anything they could ever have to do in the real world. So the question remains, what can you as an educator do to ensure that students see the relevancy of mathematics in the world around them, and how can you all but guarantee that your students can connect each unit of content in Algebra I & II to real world scenarios?


1000px-Linear_regression.svgThe following lesson plan is an example of how one might use real life examples to model mathematical concepts and keep students engaged throughout the entire lesson. This lesson designed to cover scatter plots, positive and negative correlations, and linear regressions uses TI-84 calculators and a Document Camera to model how to find linear regression equations as well as finding correlation coefficients. The following is just one example of how TI-84 graphing calculator can be used to engage students and help them relate algebraic concepts to the real world.


MA325_ModelingLP

MA325_ModelingWS