Experiment with transformations in the plane G.CO.A

This learning progression is designed for a 10th grade Geometry Class. In this unit students learn about transformations in the plane such as translation, reflection, rotation and glade reflections. The CCSS are

CCSS.MATH.CONTENT.HSG.CO.A.2 Represent transformations in the plane using, e.g., transparencies and geometry software; describe transformations as functions that take points in the plane as inputs and give other points as outputs. Compare transformations that preserve distance and angle to those that do not (e.g., translation versus horizontal stretch). CCSS.MATH.CONTENT.HSG.CO.A.3 Given a rectangle, parallelogram, trapezoid, or regular polygon, describe the rotations and reflections that carry it onto itself. CCSS.MATH.CONTENT.HSG.CO.A.4 Develop definitions of rotations, reflections, and translations in terms of angles, circles, perpendicular lines, parallel lines, and line segments. CCSS.MATH.CONTENT.HSG.CO.A.5 Given a geometric figure and a rotation, reflection, or translation, draw the transformed figure using, e.g., graph paper, tracing paper, or geometry software. Specify a sequence of transformations that will carry a given figure onto another

To teach this material I use different teaching methods as well as different activities to elicit students learning. For example, I use modeling to work detail examples and give students a visual aid in the board. At the beginning of the lesson, I use a short warm up that helps students review the material learned in the previous lesson. During and after instruction, students also have the opportunity to work with others and ask questions.  To assess students learning, I use their responses to class discussions, questions, and answers to problems in different activities For summative assessment, in this learning progression students will show their knowledge by preforming the different transformations to a shape they select and writing explanations of the changes applied to the figure.

Complete learning progression here High School Geometry
High School Statistics: Summarize, Represent and Interpret data

This learning progression is designed for an 11th-grade statistics class. The CCSS-Math meet in this learning progression are

Summarize, represent, and interpret data on a single count or measurement variable.

CCSS.MATH.CONTENT.HSS.ID.A.1
Represent data with plots on the real number line (dot plots, histograms, and box plots).

CCSS.MATH.CONTENT.HSS.ID.A.2        Use statistics appropriate to the shape of the data distribution to compare center (median, mean) and spread (interquartile range, standard deviation) of two or more different data sets.

CCSS.MATH.CONTENT.HSS.ID.A.3    Interpret differences in shape, center, and spread in the context of the data sets, accounting for possible effects of extreme data points (outliers).

The purpose of this learning segment is for students to learn to analyze, report and make inferences about data. Students will learn how to find mean, median, mode, range, and box-and-whiskers plot, as well as to write reports describing data sets. Throughout the lessons, I will give examples to help students understand the concepts. Class discussions and group work activities are designed to help students develop understanding of the concepts, create procedural fluency and elicit students reasoning.

Students will be assessed during instruction as well as formative assessment at the end of each lesson.  For the final assessment, students will show their understanding of the concepts by completing a report project.

Complete learning progression: learningprog

7.G.B.6 Volume and Surface of 3D figures

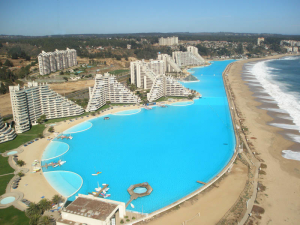
poolpool-2

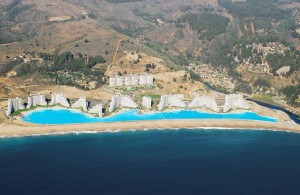
Who would not like to have a swim in this pool? This is the biggest pool in the world with  1,013 meters in length and a total area of 19.77 acres and it is located in a resort in Algarrobo, Chile. Can you imagine how much water does this pool holds? How will you find out?

CCSS.Math.Content.7.G.B.6

Solve real-world and mathematical problems involving area, volume and surface area of two- and three-dimensional objects composed of triangles, quadrilaterals, polygons, cubes, and right prisms.

Using pictures to explain and illustrate concepts help students connect those concepts from the classroom to the real world and develop higher thinking skills. In the case of this pool, volume and surface area are some of the concepts that students can learn. By showing students an “useful and fun” use of this concepts, students will develop a different thought process and connect their thinking into answering the question, how much water does this pool holds?

By challenging students to think how to answer this question, given that the pool is an irregular shape, before the concepts are introduced will help the students to start developing a thought process that go beyond the use of formulas to find the surface area/volume of prisms .

How accurate is the distance formula?HSG.GPE.B.7

How accurate is the distance formula?

Vernier is a company that produces software and equipment to be used in education. For this specific lesson, motion detectors are used to gather data. Students have the opportunity to work in groups developing a model to determine the accuracy of the distance formula. By working in groups, students have the opportunity to practice standards in mathematics such as construct variable arguments and critique the reasoning of others and model with mathematics. The activity is also aligned with the CCSS.MATH.CONTENT.HSG.GPE.B.7
Use coordinates to compute perimeters of polygons and areas of triangles and rectangles, e.g., using the distance formula.*

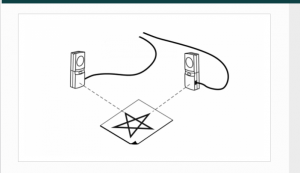
In this activity, students use the distance formula to find the distance between two points. Using the motion detectors, students can create a “live” cartesian plane and determine the coordinates of 5 points.

screenshot-2

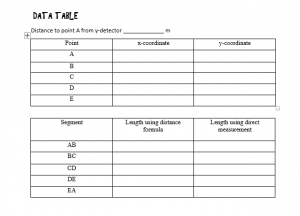
Students have to find the distance not only with the distance formula but also with a meter/yard stick. They will be recording their data in a table (Figure 1).By making measurements with different tools, students have the opportunity’s to develop ideas that connect to the concept of distance between two points.  After the data is collected, students need to compare/contrast both measurements,  determine which one is more accurate and explain their reasoning .

screenshot-4

Figure 1

Find more about this the activity here: from-here-to-there


Shifting, Reflecting and Stretching With DESMOS: HSF.BF.B.3

article

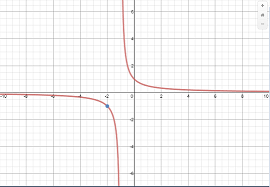
This lesson is project base. Students need to use DESMOS, to model different functions as well as to interpret the behavior of the model (graph). This lesson requires students to follow instructions, analyze graphs, explain the behavior of the graph, to check their work, create accurate models and explain their reasoning. Students need to work individually to complete this project. DESMOS is a graphing software that students can use to visualize concepts.

Lesson Link: shiftingreflectingandstretching