For students to truly connect with new ideas they need to be mentally engaged and curious in order for them to retain any knowledge. One way teachers can achieve this is having the students create their own problems and solutions as opposed to always just giving students problems out of textbooks, really having the students physically being a part of their learning through collecting data in person. This personal connection to the data will help them to achieve learning goals because they feel like they were a true part of the discovery, which they when actively performing their own experiments. Making use of technology is always a great way to get students excited, and in this activity in which students will discover exponential relations, a motion detector is used. I mean who would rather learn out of a textbook as opposed to using motion detectors to discover mathematics for themselves?
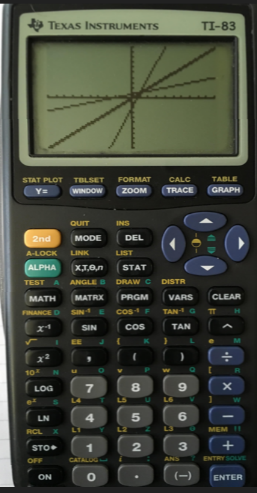
Students will be using Vernier CBR 2 motion detectors that hook up directly through 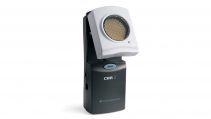 the graphing calculators linking port, or for the TI-84 Plus, TI-84 Plus Silver Edition, TI-Nspire or TI-Nspire CAS, the CBR 2 can hook up through the USB port. When hooked up with a calculator it should automatically bring up the reading screen displaying the CBR and any distance detected by the sensor, with the options of: file, setup, start, graph, and quit. The technology is very intuitive making it fairly simple to use.
In this activity, students can be put into groups of about 5 to 6 and they will be testing the exponential pattern of rebound heights. They will be doing this using a small ball (bouncy ball, basketball, tennis ball, etc.) paired with the motion detector to measure the continuous height as the ball bounces. On a side note, have the students compete in their groups to see who can bounce the ball the best straight up and down, this should help deplete any problems of having balls flying all over the classroom and help to spark engagement of all students just as competition always seems to do best. This will also help to result in the most consistent and valid data, which is important in the activity. Group work also promotes cooperative skills needed for students to be successful and responsible citizens in a diverse society as they learn to work together, and to accept and critique ideas in order to come to a joint resolution.
Students will simply position the CBR 2 about a meter and a half over the ground and when the individual with the steadiest bounce is crowned in each group, they can position their ball at a starting point of a meter off the ground directly under the CBR 2 detector, then press start on the calculator screen and drop the ball. The graphing calculator will then graph the position of the ball. The first objective for th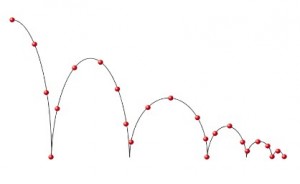 e students is to derive the rebounding heights of the ball. When the graph on the calculator shows the time/distance relation, the students will see a parabolic trend pattern getting smaller and smaller, and they can use the “find maximum” tool under trace on their calculator to find the maximum height of the ball on each bounce.
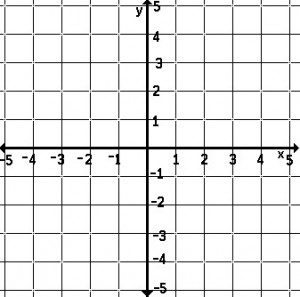
Students will then record these heights in a table according to the number of bounces occurred, starting at 0 with the initial height determined (have all groups start with initial height at a meter), and so on until the ball was ultimately resting, about 5 or 6 bounces in. With the data entered into a table, both physically and into the table setting in the calculator, students can plot them onto a graph and discover the exponential pattern of the rebounding heights! The exponential function from the activity will be shown as y = Apx where y is the rebound height, A is the initial height (1 m), and x the number of bounces. This section of the analysis directly correlates to the common core standard: CCSS.MATH.CONTENT.HSF.LE.A.2
Construct linear and exponential functions, including arithmetic and geometric sequences, given a graph, a description of a relationship, or two input-output pairs (include reading these from a table). Students will also derive the value of p by plugging in the data derived in the experiment, which also directly correlates to the common core standard: CCSS.MATH.CONTENT.HSF.LE.B.5
Interpret the parameters in a linear or exponential function in terms of a context.
Students should be able to be able to more easily interpret the parameters of exponential functions and situations when being the ones who create them; positioning the ball at the initial height, and seeing how the function compounds (by number of bounces). When just giving students an equation such as y = Apx, most if not all would have any idea what any variable stood for. After performing this activity, students should be more successful in being able to determine the components and parameters in an exponential function and where each value comes from.
You can purchase the CBR 2 motion detector for the classroom on the Vernier website for $99 (http://www.vernier.com/products/sensors/motion-detectors/)
Decaying Bounce Worksheet
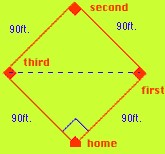
 ested and they truly were engaged by the mathematical dynamics that makes up the game of baseball, teachers could build upon the dimensions of the field to prompt students towards higher level mathematics applications, for example using a runner’s actual speed and distance needed to travel to figure out how fast the baseball would have to be thrown to successfully throw the runner out (with a direct throw.) Teachers might also use the triangles found in the infield and speak upon congruency theorems!
 taking a drink? Most, if not all students, should be able to relate to this from previous real life experience. I found this “Joulies” activity from a list of Dan Meyer’s 3-Act math projects. In this project, students will be analyzing the relationship between the cooling temperatures of hot beverages, with and without the advertised product “Joulies”. Students will do so by using temperature probes to record both of the cooling temperatures graphically. Joulies are advertised as being able to cool a hot beverage such as coffee or tea to a perfect drinking temperature three times faster while also staying warmer twice as long, through the activity students will be able to determine the validity of this advertisement.
 with the Vernier Easy Data App & Easy Link USB Interface it makes it very easy to use TI-84 plus calculators to hook our temperature probes up and record desired data. In the lesson plan and activity attached, you will read how this technology is involved in helping students achieve the common core state standard: