High School Algebra: Creating Equations
This learning progression will be taught at Ellensburg High School in an Algebra 1 course. The students in the class this lesson progression is being taught in are all good students. By that I mean each student is a diligent and hard worker. Knowing this I have decided to deviate from the usual required text and use tasks from CCSS Problem-Based Tasks for Mathematics I. These tasks are tied directly to a CCSS and incorporate real-world applications. Knowing that my students are capable I am positive that they will transition well from their regular work from the required text book to these problem-based tasks I have found for them to do.
In between the time this learning progression starts and when the school year starter the students have learned the following:
Reason quantitatively and use units to solve problems.
- MATH.CONTENT.HSN.Q.A.1
Use units as a way to understand problems and to guide the solution of multi-step problems; choose and interpret units consistently in formulas; choose and interpret the scale and the origin in graphs and data displays.
- MATH.CONTENT.HSN.Q.A.2
Define appropriate quantities for the purpose of descriptive modeling.
- MATH.CONTENT.HSN.Q.A.3
Choose a level of accuracy appropriate to limitations on measurement when reporting quantities.
Interpret the structure of expressions.
- MATH.CONTENT.HSA.SSE.A.1
Interpret expressions that represent a quantity in terms of its context.*
- MATH.CONTENT.HSA.SSE.A.1.A
Interpret parts of an expression, such as terms, factors, and coefficients.
- MATH.CONTENT.HSA.SSE.A.1.B
Interpret complicated expressions by viewing one or more of their pa rts as a single entity. For example, interpret P(1+r)n as the product of P and a factor not depending on P.
The students have mastered these concepts and CCSS through activities and tasks out for their required text. Thus, the students are prepared and have the appropriate academic knowledge to begin learning concepts tied the CCSS HSA-CED.1, 3 & 4. Note the reason this learning progression does not cover HSA-CED.2 is because that has already been covered in previous lessons when teaching linear equations. As I explain the tasks for each of the CCSS 1, 3 & 4 I will explain how the students’ prior academic knowledge was necessary; as well as, how the new concepts build off of the students’ prior knowledge will help them gain a deeper understanding of the new concepts. However, before beginning the explanation of the tasks and assessments I would first like to discuss my instructional strategies.
When teaching the learning progression I will use direct instruction and the use multi-media to communicate the learning targets, the concepts, and the directions for the tasks. The initial discussion will not provide examples. I want the students to struggle and make their own inquiries about how to solve the posed problems. I will then make use of grouping to have students work together on the tasks and make inquiries as a group. Just like how these tasks are real-world applications I want the students to also learn that in real life you made need to ask someone for help and work together to solve problems. Because I know that my students are diligent workers and that they have worked well in groups before, I know that by having them tackle real-world, problem-based tasks together will yield more positive results. Lastly, this learning progression will only include formative assessment since all work will be done in groups and I want to assess discussion and inquiry not mathematical correctness. Though, before moving on there will be a section of the lessons where I will help students through effective questioning reach the correct answers almost like how the Socratic Method does it.
Lesson 1: Problem-Based Task: Free Checking Accounts Coaching
The figure to the left is of the first t ask of the learning progression. As shown in the figure the task is tied directly to the CCSS, A-CED.1 (HS is left off because it is understood this text is for high school mathematics 1). This text has tasks in order of what is required to learn the following concept not just in order of CCSS. Thus, this text incorporates scaffolding to effectively organize tasks and CCSS. The figure above describes a word-problem but it isn’t simply just a word-problem; it is a word-problem that describes a real-world scenario that students know they may one day be faced with creating an innate interest within them to learn how to solve the problem. On the next page of the text shown in the figure there are several questions posed related to the above word-problem:
- What is the minimum money you want to have to open your checking account?
- How much are you depositing each week?
- What inequality can be written to model the scenario?
- What is the solution to the inequality?
- What does the solution of the inequality represent in terms of the context of the problem?
When beginning this first lesson I will go over the CCSS and break it down for the students to better understand what is expected of the to learn from this task. I will then allow students to start to work through the given problems I have listed above as I walk around and use inquiry-based learning and the Socratic method to invoke deep, and critical thinking. I know that my students are capable of deriving the solution to the posed problems with minimal hints from me because I have taught them the necessary problem-solving skills and mathematical knowledge required to; however, like I said prior I did not provide any examples of procedures. Thus, students will struggle with ideas and procedures but as I walk around the room I may hint or pose effective questions to a group to help them solve a problem.
This task requires students derive an inequality and know what that inequality says about the posed problem; however, the students have not learned anything about inequalities but what they have learned is the structure of one variable equations and how to derive them from given information. The hint I will have to present to the students once I have noticed they have all gathered the information and are discussing how to express it as an equation is that an inequality is written just like an equation and would then present the appropriate syntax and notation to them. The point of this is that the students have been in deep discussion and thought about how their group can express the information after struggle to find an answer it will click for them with the information I present. Because the students know the procedure for deriving a one-variable equation from given information, I know that they are capable of deriving a one-variable inequality once I have given them that hint. But if any of the students have not derived the inequality or did not understand how their group did, I would in the last five minutes of class go over the procedure for deriving the inequality and what the correct inequality is. Their homework would then be to answer that final question (e) and be prepared to discuss it the following lesson. This would allow the students to continue to either find the solutions on their own or struggle with the concept and be confused the following lesson. Why is it good for a student to be confused the following lesson and be unable to finish his/her homework, because I know that they are on the precipice of understanding the concept and with a little nudge they will get it.
Lesson 2: Problem-Based Tasks: Skate Constraints
As shown in the figure the next lesson covers A-CED.3. This lesson is quite a bit more extensive and may require two days to complete. The reason the previous lesson was less extensive is because the students will be continuing to derive inequalities. The first lesson was meant to have students struggle with the idea of whether or not the procedure of deriving a one-variable equation 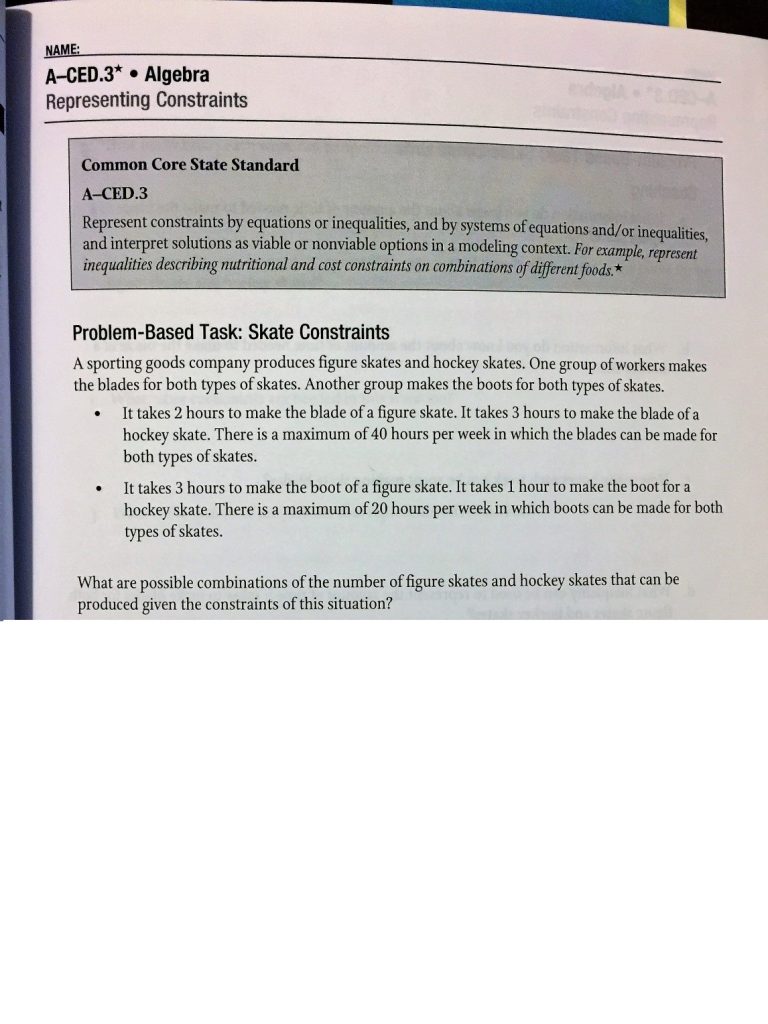 could be applied to deriving a one-variable inequality and what an inequality represented in terms of the given information. Now the students will continue to struggle towards complete mastery of those concepts while they learn more and more about inequalities till they have all of the learning blocks necessary to have mastered inequalities. Thus, the students will be using the previous lessons knowledge in this lesson.
I will be using the same lesson outline but with a few minor changes. Instead of letting the students struggle through the posed problems immediately after going over the CCSS and directions I will go over some definitions found in the CCSS: constraints, viable and nonviable. I will need to provide an example of what a constraint is and explain why they are necessary. I would use the previous lessons inequality to do and explain how it would not make sense to have negative deposits hence there must be a constraint stating that “x” constraints must be greater than or equal to zero. I would not tie this example to the students’ posed problems in this lesson because again I want them to become confused and struggle to find the solutions. Once I had finished going over any necessary information I felt like would make the task impossible to do without I would let the students loose to begin working in their groups. The text provides these following posed problems:
- What information do you know about the amount of time needed to make the blade of a figure skate?
- What information do you know about the amount of time needed to make the blade of a hockey skate?
- How many hours each week can be spent making skate blades?
- What inequality can be use represent the amount of time it takes to make blades for both figure skates and hockey skates?
- What information do you know about the amount of time needed to make the boot of a figure skate?
- What information do you know about the amount of time needed to make the boot of a hockey skate?
- How many hours each week can be spent make skate boots?
- What inequality can be used to represent the amount of time it takes to make the boots for both figure skates and hockey skates?
- What other constraints are needed in this situation?
- What is the system of inequalities that represents this situation?
- Is it possible to construct 3 figure skates and 4 hockey skates given the constraints of this situation?
This task requires that students create two-variable inequalities which is very new because the students have not worked with two-variable equations yet so they are bound to struggle with how to express the information given as an equation; however, they have the necessary knowledge and problem-solving skills so with I am hoping that with no hints the students will derive the equations themselves. As I did in the previous lesson though, if no students have managed to derive the correct two-variable inequalities I will go over the right way to solve the first inequality maybe 30 minutes into the class so they will have to struggle with the constraints and what the inequalities represent. Then, in the following lesson I would we would go over as a class all of the problems and together answer questions (k).
Lesson 3: Problem-Based Tasks: Bricklayers
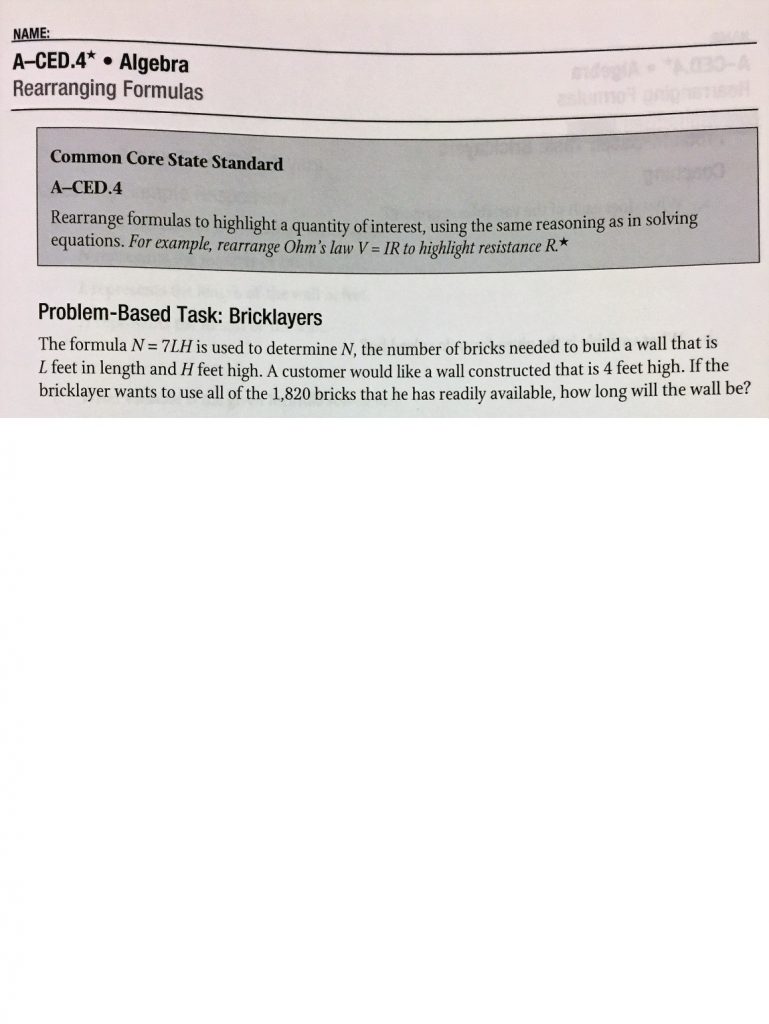 This is the last lesson of the learning progression. Now this lesson if important and though it does not have to do with inequalities at first glance it actually does; it has to do with all equations and expressions.