Students these days tend to lack exercise due to the constant use of technology. This real world problem engages students in a fun math activity that combines the use of technology with exercising. By monitoring their own heart rate students will have the opportunity to analyze the relationship between the dependent variable and the independent variables using graphs and tables, and relate these to equations that represent data applicable to real world problems. 
On the livestrong.com website, Sarah Dray(2013) claims “Once you stop your workout, your heart rate should drop by about 20 beats during the first minute. People who have a reduction of 12 or less during that first minute are at a higher risk of suffering a heart attack later in life.” Are you at risk of suffering a heart attack later in life?
To have students answer this question they will need to monitor how fast their heart rate returns to normal after exercise with Vernier heart rate monitors and TI-84 graphing calculators.

http://www.vernier.com/products/sensors/hgh-bta/
As a class decide what type of exercise the students would like to partake in?(bunny hops, umping jacks, jogging in place, etc.)
After demonstrating how to use the technology. Have students break up into groups of four. The students should rotate taking turns monitoring their heart rate.
Students will see if their heart is in a health state by starting at rest, exercising for a minute, and then stopping and letting their heart return back to normal. Students will collect data of their heart rate every 10 seconds for the 2 minute period.
The common core standard of focus:
CSSI 6.EE.9 Use variable to represent two quantities in a real-world problem that change in relationship to one another; write an equation to express one quantity, thought of as the dependent variable, in terms of the other quantity, thought of as the independent variable. Analyze the relationship between the dependent variable and the independent variables using graphs and tables, and relate these to the equation.
To achieve the standard above have students make a table and graph of their data collected. Then with guided instruction have them write two equations. One equation reflecting how fast the heart rate accelerate during exercise and another equation reflecting how quickly the heart rate slowed during recovery.
To guide the student through the activity use the student handout attached and have the students fill out the handout as a group. By collaborating in groups they can learn how to respect each others thoughts and ideas, preparing them to be responsible citizens in a diverse society.
After the activity encourage students to bring their parents in during recess or lunch hour during the following day. Students can teach their parents how to use the equipment and test their parents heart health by monitoring the rate the parents’ heart recovers after a period of exercise.
Student Handout:
1. What is the independent variable?
2. What are the units of the independent variable?
3. What is the dependent variable?
4. What are the units of the dependent varibable?
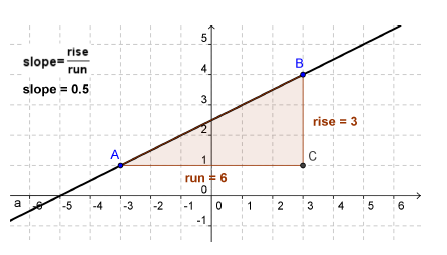
5. What type of slope occurs when you begin to excersise?
6. What type of slope occurs when you let your heart rate return to its resting state?
7. What type of slope occurs if you just remain still.
Fill out the Table representing your heart rate. Make sure to include units
Time Heart Rate
Graph the the information on your table. Make sure to label your axis.
8. Write one equation reflecting how fast the heart rate acclerated during exercise.
9. Write a second equation reflecting how quickly the heart rate slowed during recovery.
10. Based on your data are you at risk of suffering a heart attack later in life? Explain.


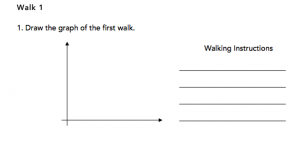 Students work in groups of four: a. one person walks, b. another operates the calculator, c. another draws the graph on the calculator, and d. the graph of the peers walk, and the final person gives and writes the walking directions. On the next walk the students switch tasks, so that everyone performs all tasks.
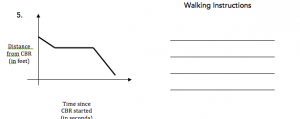
 TI- 83 or 84