6.SP – Staying Healthy

Using Heart Rate Monitors and Speed Radars during Exercise

In this activity the students will be doing a series of exercises to monitor their heart rate, speed, and amount of exercise to calculate mean, median, mode, and distance. We want to find out if the class as a whole is in the healthy range for their sex and age group. The equipment needed for this activity is heart rate monitors, speed radars, and timers. The students will be split into groups for the different stations. The stations include a running station, jump rope station, and a sit up station. Each student will be wearing their own heart rate monitor. Within these groups the students will find a partner to measure all of their exercises using timers and the Sport Radar. The students will need one timer per pair, one Sport Radar for the running group, 10 jump ropes, and materials to record their information.

The Common Core State Standards that this activity measures are:

Grade 6:

Building on and reinforcing their understanding of number, students begin to develop their ability to think statistically. Students recognize that a data distribution may not have a definite center and that different ways to measure center yield different values. The median measures center in the sense that it is roughly the middle value. The mean measures center in the sense that it is the value that each data point would take on if the total of the data values were redistributed equally, and also in the sense that it is a balance point. Students recognize that a measure of variability (interquartile range or mean absolute deviation) can also be useful for summarizing data because two very different sets of data can have the same mean and median yet be distinguished by their variability.

 CCSS.MATH.CONTENT.6.SP.B.5.C
Giving quantitative measures of center (median and/or mean) and variability (interquartile range and/or mean absolute deviation), as well as describing any overall pattern and any striking deviations from the overall pattern with reference to the context in which the data were gathered.

High School Functions

In school mathematics, functions usually have numerical inputs and outputs and are often defined by an algebraic expression. For example, the time in hours it takes for a car to drive 100 miles is a function of the car’s speed in miles per hour,v; the rule T(v) = 100/v expresses this relationship algebraically and defines a function whose name is T.

The SKLZ Sport Radar can be found at Wal-Mart or:

http://www.walmart.com/ip/21666148?wmlspartner=wlpa&selectedSellerId=0&adid=22222222227015962974&wl0=&wl1=g&wl2=c&wl3=45286948592&wl4=&wl5=pla&wl6=88657884032&veh=sem

sport radar

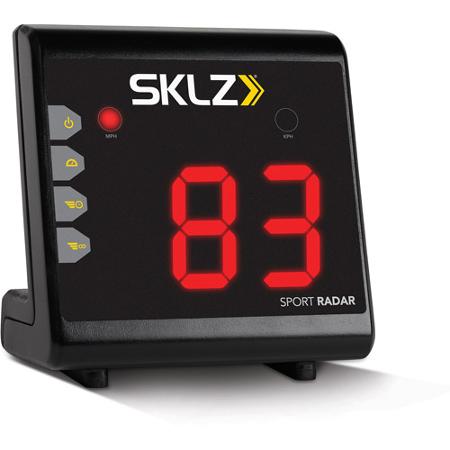
This piece of technology costs $19.00-$45.00. In this group, Group 1, the students will use the speed radars to measure their speed for running 200 feet. They will then be asked to calculate their time in which they ran the distance and compare it to what their partners clocked for them. The students will record their time, heart rate, and speed. This information will be used at the end of the lesson for the classes mean, median, and mode for all of the stations.

The Polar Heart Rate Monitor can be found at Best Buy or:

http://www.bestbuy.com/site/polar-ft1-heart-rate-monitor-black/1170016.p?id=1218283545033&skuId=1170016&ref=06&loc=01&ci_src=14110944&ci_sku=1170016&extensionType=pla:g&s_kwcid=PTC!pla!!!80032725394!g!!40885790194&kpid=1170016&k_clickid=337686b8-31e5-9828-b301-000054d96bf6&kpid=1170016&lsft=ref:212,loc:1&ksid=337686b8-31e5-9828-b301-000054d96bf6&ksprof_id=9&ksaffcode=3252&ksdevice=c&gclid=CJaz0rupqMICFcZbfgodYS0A_A

heart rate watch

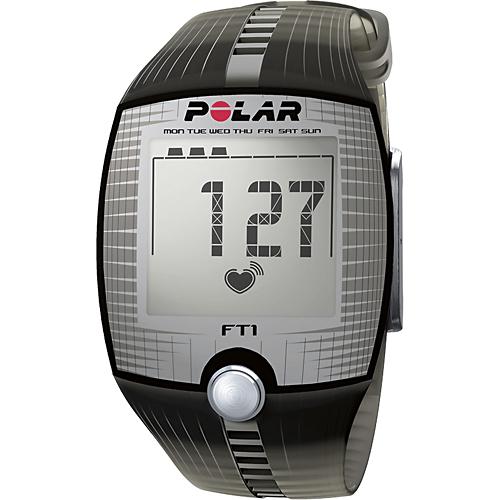
The Polar Heart Rate Monitor costs $36.99. Each student will wear these watches to measure their heart rate during their activity at all of the stations.

In Group 2 the students will be jump roping for 30 seconds. The partner who is not participating will count how many jumps the student successfully completes. After the 30 seconds the student will record their heart rate and amount of jumps they did.

In Group 3 the students will be doing sit ups for 30 seconds. The partner who is not participating will count how many sit-ups the student successfully completes as well as hold their feet. After the 30 seconds the student will record their heart rate and amount of sit-ups they did.

Once every student has finished with all of the activities, they will need to compile all of their recording with the rest of the other students’ numbers. On the excel spread sheet the students will write down their times, speeds, and numbers for all of the stations based on sex. The information will be anominous so that the students will not be criticized on their scores. After all the information is written down, copies will be made and distributed to all of the students to find the mean, median, and mode of all the categories. As a class we will find out if the students are in the healthy range for their sex and age group according to the CDC. The boys will calculate the boys excel spreadsheet and the girls will calculate their own. Teachers could also have the students graph the numbers to observe the bell curve.

Excel spreadsheet: Math 325 Heart Rate Monitors

4.MD – Capture the Area

diceMath Concept: Area

Target Grade Level: 4th Grade

CCSS.Math

4.MD.A.2: Apply the area and perimeter formulas for rectangles in real world and mathematical problems.

  • Students will be applying the area formula for rectangles to determine the total area of each rectangle that they draw. Students will be applying the formula repeatedly with different combinations of dimensions.

CCSS Mathematical Practices

MP2: Reason abstractly and quantitatively.

  • Students can work with the numbers generated by rolling the dice to find an answer, but can also understand that the numbers represent something concrete. Students must realize that the numbers being rolled represent the length and width of their rectangles rather than just numbers. They must also be able to attach the given measurement to the number. For example, a roll of 5 and 6 gives a rectangle with the dimensions of 5m x 6m and an area of 30m2.

MP6: Attend to precision.

  • Students must be able to determine that if each square on the graph paper represents one square meter, then each side is one meter. Students must then be able to apply this when translating the numbers on the dice to the dimensions of the rectangle and when calculating the area of the rectangle. Students can determine if their answer makes sense by looking that the actual rectangle that has been drawn and by paying close attention to the units. For example, a roll of 3 and 4 would have to translate to a 3m x 4m rectangle with an area of 12m2. If students end up with 3m2 x 4m2 then the area would end up being 12m4. Students would need to realize that these units do not make sense when compared with their drawing that shows 12 square meters.

Learning Targets

Students will be able to explain the concept of square units.

Students will be able to apply the area formula for a rectangle.

Academic Language

  • Dimensions (length, width)
  • Area
  • Square unit

Activity Purpose

This activity allows students to see how and why the area formula for a rectangle works. While playing, students can see that multiplying the dimensions will give them the total number of squares that are inside of the rectangle. Students will also be able to see where the idea of square units comes from. Students will be given the opportunity to not only solidify this understanding, but they will be given ample opportunity to practice applying the area formula. On every turn students will be drawing a rectangle and finding the area. Students will also continuously roll different numbers giving them practice with different dimensions, and showing that the area formula works consistently.

Activity: Capture the Area

Objective: To capture as much the “land” as possible

Time: 20-25 minutes

Players: 2-4  players

Materials

  • A pair of dice (1 pair for each group)
  • Centimeter graph paper
  • Colored pencils (crayons and markers will also work)
  • Copy of directions/discussion questions for each group (attached) Capture the Area- Directions

Technology

For this activity there is no need to use technology. A calculator could be used for students who need that adaptation.  However, a primary goal of this activity is to practice mental math and quick recall of multiplication math facts.

Problem

Neighboring farmers trying to acquire unclaimed farmland. The land can only be acquired in rectangular pieces. Instead of fighting for the land, the farmers have decided to take turns claiming pieces of land as determined by rolling dice. Each square plot of land is one square meter. Each farmer wants to get as much land as possible.

Directions/How to Play

  1. Each player starts in a different corner and uses a different color colored pencil.
  2. Players will roll a die to determine who will go first. (Highest roll goes first and game play continues clockwise).
  3. Players roll the dice to find the dimensions of a rectangle that they will draw using their assigned color. Players assign one number to the width and the other number to the length of the rectangle. In addition to drawing the rectangle, players must write inside the rectangle the dimensions and the total area. Players start with the first rectangle in their own corner.
  4. Each rectangle that follows must be drawn so that it is touching one of the sides of that player’s previous rectangles.
  5. Game play ends when all players have met in the center or when no more rectangles can be drawn or at a specified time. To make games quicker use centimeter graph paper. 
  6. Players then find the total amount of area they have acquired.
  7. The player with the greatest total area is the winner.

Example

Capture the Area Student Examples0016 Discussion Questions

These questions are given to students in their groups or pairs to discuss. Students should be encouraged to use academic language (i.e. area, dimensions, square units) when answering the questions. Once students have discussed the questions in their groups, the teacher should initiate a whole class discussion.

  1. As a farmer, why would you want all of your land together?
  2. Why would you want rectangular plots of land?
  3. Who won?
  4. Why did they win?
  5. What kind of dimensions do you want to role? Larger numbers or smaller numbers? Why?
  6. What is the largest area that you can get from rolling the dice? What is the smallest area you can get?
  7. How does the area formula work? Why do we multiple the length and the width?

Assessment

The answers to the discussion questions will serve as a formative assessment. The teacher should also be circulating the room and using observation to formatively assess students’ knowledge of multiplication facts and their ability to apply the area formula.  

Adaptions

There are a number of possible adaptions to make this lesson appropriate for younger or older students.

For younger students:

  •  Add the two numbers rolled to determine the total number of squares that can be claimed.
  • Give students multiple dice so they can practice adding three or more numbers at a time.

For older students (or for students who need an extra challenge):

·         Assign each student a particular crop. Each crop is worth a certain amount of money. In addition to determining the total area, students can also determine the total amount of money they could make.

  • Convert the total area from square meters to square centimeters and/or square kilometers.
  •  Determine the amount of fencing required to enclose all of the acquired land within one fence.
  • Use triangles rather than rectangles. The numbers rolled would indicate the base and the height of a right triangle. Students would then have to determine the area of the triangles.

Additional Teacher Suggestions

We designed the modeling activity “Capture the Area” to allow students the opportunity to apply the area formula in real world problems to meet the CCSS 4.MD.A.2. We also felt that this could be a great activity to connect to students’ prior knowledge about area measurement.  This builds on their initial learning of the third grade standard CCSS 3.MD.C.5.A.

While teaching this activity we realized the importance of relating the activity to student interests.  To do this we discussed with students what they would like to farm on their land such as crops or animals.  This helped to increase their buy in for the activity.

We also noticed that some students struggled with the third grade square unit concept.  This means that this concept may need to be retaught.

Additionally, we learned that using larger graph paper makes it easier for people to see what they are doing and to complete the task. Smaller graph paper made the activity more tedious and made it difficult for students to follow their own work. 

Modeling Activity designed by Julie Murphy and Emily Phillips.

4.MD-Campus Tours!

Campus Tours by Hollie Lamb and Ed Mejia

Target Grade Level:  4th Grade
Map Activity

4.MD.A.1 Solve problems involving measurement and conversion of measurements from a larger unit to a smaller unit.

4.MD.A.2 Use the four operations to solve word problems involving distances and intervals of time.

Standards for Mathematical Practices to be Emphasized:

1.A Make sense of problems and persevere in solving them.

  • This practice supports the identified standards by framing clear and explicit mathematical challenges.  The modeling activity prompts are scaffold in such a way that aids students in clarifying the mathematical processes that are required.

1.D Model with mathematics.

  • This activity allows students to transfer skills between general mathematical representations and real-world scenarios.  In this modeling activity, students will be asked to convert distances from a larger unit to a smaller unit whilst using a distance scale key.

1.E Use appropriate tools strategically.

  • In this modeling activity, student swill be referring to the distance scale included in the campus map.  Using index cards to accurately measure scale distances will provide students the opportunity to use tools to attend to precision and accuracy.

1.F Attend to precision.

  • Students will have to be able to use the scale accurately when finding the distances between buildings.  There will be emphasis during the modeling activity to attend to the accuracy of the required operations to answer the prompts.

Materials and Equipment:

  • index cards
  • maps
  • Campus Tours worksheet
  • calculator
  • pencils
  • highlighters (recommended for making paths on map)

Modeling Activity

Purpose:  Students have previously learned grade 3 standards of solving problems involving measurement and estimation of time, volume, and mass.  Students are now ready to extend these skills to develop the abilities to solve problems pertaining to the conversion of larger units to smaller units, and using operations to solve problems dealing with distances and time.

see attachments for worksheet and campus map CWU Campus Map Campus Tours

5.MD-Picture Problem: Predicting and Calculating Volume

 Many Too Many Small Boxes and Maru 2

Video found at: https://www.youtube.com/watch?v=Am3NVGP9rkQ

This video shows 4 different sized boxes and a cat, Maru, who tries to fit inside them. The video presents a “competition” between the boxes and which one the cat ends up choosing as his favorite. The math problem that I would present would be to ask the students to predict the sizes of the boxes. They would list the boxes they thought was the smallest to the largest. The students would also predict which box they think Maru will choose in the end; extra credit for the students who choose correctly. The students would measure the screen on the computer to find  the height, length, and width of each box. Then they would solve for the volume for the 4 boxes. After everyone has found the volume the teacher would play the video to the end for the students to see the outcome.

CCSS.MATH.CONTENT.5.MD.C.5.B
Apply the formulas V = l × w × h and V = b × h for rectangular prisms to find volumes of right rectangular prisms with whole-number edge lengths in the context of solving real world and mathematical problems.

7.SP-Friends Around a Table

Illustrative Mathematics Modeling

Friends Around a Table

Composed by Don, Maile, and Nia

IMAG0306

CCSS addressed:
7.SP.C.8.a: Understand that, just as with simple events, the probability of a compound event is the fraction of outcomes in the sample space for which the compound events occurs.

7.SP.C.8.b: Represent sample spaces for compound events using methods such as organized lists, tables and tree diagrams For an event described in everyday language, identify the outcomes in the sample space which compose the event.

Materials Needed:
• 4 miniature dolls per “table”
• 1 “table” (this can be a piece of cardboard, a book, or another square object)
• Paper and pencils

Lesson:
1. Hook:
Penguin, Tiger, Bear, and Frog are seated at random around a square table, one person to each side. What is the theoretical probability that Penguin and Tiger are seated opposite from each other?

IMAG0303

2. To do:
Students need to draw pictures or use manipulatives of the problem. They should list all the possibilities and record that number as the total. Then they should list all the outcomes where Angie and Carlos are seated opposite each other. They should list all the combinations were this happens and record that number as the desired outcomes. This fraction is the theoretical probability. Students should make a chart of their data. Students can work in small groups to solve this problem.

3. Discussion Questions:
• What are some ways we can figure out how to answer this question?
• How can we set up what we know in a way to help us solve this?
• What information do we know? What do we need to know?
• How many ways can these 4 friends sit around the table (with no duplicates of course)?
• What if Penguin decided that he did not want to give up his seat, how would this change the amount of possible sitting arrangements?

4. Wrapping up:
Students will discuss and share their totals (how many total sitting arrangements there are). Seeing if there are any “outliers” or numbers that just don’t seem to fit with the rest of the classes data (1 number just does fit with the rest). If there is an outlier then that number is thrown out of the “group” (that data is not used in the resulting discussion). Next, ask the students how many times they found that Tiger and Penguin sat across from each other. Students should look to their lists and come up with a single digit answer. Ask the students to use this number and create a fraction that incorporates their total number of sitting arrangements as a whole. Finally, ask the students, “what do you notice about the fraction you created and why do you think this fraction makes sense?” Students should have a variety of answers and it should lead to a valuable discussion about probability, and combinations.

Possible problems:
• Students may not list all possible combinations of seating arrangements.
• Students may accidentally list a sitting combination multiple times (having a double) and thus their resulting answer will be inaccurate.
• Students may not be responsible with the dolls, and thus they may not have the opportunity to work with them (these dolls are manipulatives and thus should be tried like manipulatives, with a purpose, and not as a toy).

Extensions:
• More “students” or dolls can be added to increase the difficult, “now there are 6 friends wanting to sit at the table, what are the new possible sitting arrangements?”
• Adding other conditions such as Frog needs to be seated to Tiger’s right.
• Giving Penguin and Bear fixed seats will decrease the amount of sitting arrangements, while still illustrating the same concepts/learning targets.

Concepts:
This activity is designed to show how modeling and theoretical probability can be used to solve compound event problems. Students can generate a list of all desired outcomes and divide that by the total possible outcomes. This lesson can also show how permutations can be used to find all possible outcomes.
Students will need to be able list and understand sample space, desired outcomes, and fractions.

Aspects of mathematical modeling:
1. Making assumptions and approximations to simplify a complicated situation.
3. Identify important quantities and organize their relationships using such tools as diagrams, two-way tables, graphs, flowcharts, and formulas.
4. Analyze those relationships mathematically to draw conclusions.
5. Interpret their mathematical results in the context of the situation and reflect on whether the results make sense.

Math Practices used:
1. Make sense of problems and persevere in solving them.
2. Model with mathematics.
3. Use appropriate tools strategically.
4.Reason abstractly and quantitatively.

Resources:
• https://www.illustrativemathematics.org/illustrations/885

Poll Student to Improve Mathematics Instruction

Collecting information from students is a very powerful teaching practice. Teachers can collect information about student interests, knowledge, or even self assessments. For example, teachers can use information collected from polling students to individualize math problems or use teaching practices that are more engaging. Another use of student poll data is to collect and use data on what students know or don’t know. A great method of polling your class is through an classroom internet website site or the eClicker app on the ipad.