Geometry in Basketball G.MG.A

Related image

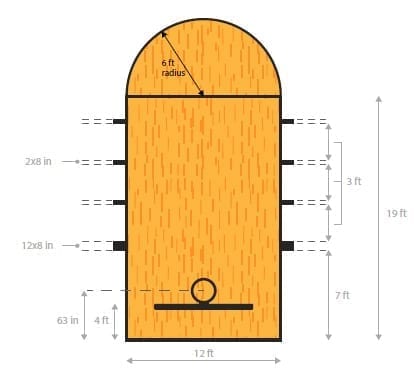
Problem: The dimensions of the area known as the “key” in high school basketball are above.  The rectangular area is 12 feet by 19 feet.  The area connected to the top of this rectangle is a half circle and has a radius of 6 feet.  Find the combined area of the two shaded regions.

The CCSS aligned with this problem is:

CCSS.MATH.CONTENT.HSG.MG.A.1
Use geometric shapes, their measures, and their properties to describe objects (e.g., modeling a tree trunk or a human torso as a cylinder).*

I selected this problem because basketball season is beginning and many students connect with the sport.  However, many students who do follow basketball aren’t aware of the dimensions of the court, so I felt that it would be an interesting topic.  This task requires students to use their knowledge of areas of rectangles and circles, as well as their mathematical reasoning abilities to solve for the overall area.  If I was teaching this lesson I might leave the dimensions off of the picture and have the students measure the dimensions in the school gym as partners, then solve for the area using their own measurements.  This makes the activity more involved and engaging.

Pizza Price MG.A.3

Image result for Dominos pizza

CCSS.Math.Content.HSG.MG.A.3
Apply geometric methods to solve design problems

For this picture, I would create a problem related to area of a circle and ratios. The students would be given the diameter of three different sized pizzas then the price of each of those pizza and the students have to determine what deal is the best, that is what has the lowest price per area of pizza ratio. At Domino’s Pizza they have three carry out deals, a Medium for $5.99, and Large for $7.99, and an Extra Large for $9.99. The Medium pizza has a 12 inch diameter, the Large has a 14 inch diameter, and the Extra Large has a 16 inch diameter. This problem relates to the CCSS because it is about using geometric areas and ratios to solve a problem. This picture and problem will get the students interested because I am sure all students like pizza and would love to find the best deal for when they want to buy pizza themselves. Since high school students do not have a lot of money, finding the best deal will definitely draw their attention. The students will work with the concept of ratios and how they can relate to areas.

Laws of Sine & Cosine (Shadows) SRT.10&11

Image result for building and shadow
Problem: Mike is looking at a building that is 300 feet away from him. If the angle of elevation between his position and the building is 25 degrees, how tall is the building?
HSG-SRT.D.10 Prove the Laws of Sines and Cosines and use them to solve problems.
HSG-SRT.D.11 Understand and apply the Law of Sines and the Law of Cosines in right and non-right triangles.
The purpose of this picture is to guide the lesson of the day. By using the shadow of a building students can relate the usage of the Law of Sines and Cosines to real life scenarios. This will provide a better understanding of the properties of the laws and provide a visual representation.

The Art of Geometry SRT


CCSS.Math.Content.HSG.SRT.B.5
Use congruence and similarity criteria for triangles to solve problems and to prove relationships in geometric figures.

This picture will be covered in my geometry class. The purpose of the picture is to start talking about how mathematics is a form of art. You can find mathematics in every type of art. The lesson that will be covered to relates to this picture is finding corresponding and supplementary angles. The assignment will be for the students to create their own drawings and label the types of triangles and angles in their picture.

Pizza Problem GMD.A

Image result for pizza
Problem:
If I ordered a pizza with an area of 200 inches and a height of 3 inches then what is the volume of this pizza?
CCSS-Math:
HSG-GMD.A.3 Geometric Measurement & Dimension
Explain volume formulas and use them to solve problems.

I choose this activity because who does not love pizza. We are in football season again and everyone is always enjoying a slice of pizza. This gives the students a chance to work out a math problem that involves something they actually might like and get them interested in how to find volumes of cylinders or any other figure. The teacher could  present this problem in many different ways. The teacher could actually order a pizza for the class and have them get into groups of 4 and try and solve it. Once each group gets the solution to the problem then they could share their answers to the whole class and then enjoy a delicious slice of pizza.

Pumpkin Pie Problem GMD.A

The Problem:

If I had a whole pumpkin pie with a diameter of 8 inches, and a height of 2 inches, what is the maximum amount of pie I could eat? Find the volume of the pie.

CCSS-Math:

HSG-GMD.A.3 Geometric Measurement and Dimension: explain volume formulas and use them to solve problems.

The relevance of this activity is that it can be used around Thanksgiving time, so the students have a real life example of how and when they could solve for the volume of a shallow cylinder. The teacher could have a couple different approaches for student engagement. He/she could have his/her students discuss in their groups what they think the solution is, the students could have this as an individual entry task, or there could simply be a class discussion of the process to solve this problem. All of those options could engage students in their current understanding of finding the volume of a cylinder, as well as allow the teacher to lead the lesson based off of the students’ findings. If the teacher wanted to take that extra step, he/she could potentially bring in an actual pumpkin pie for the students to reference (and possibly eat).

Mystery (Function) Machine F-IF.1&7

CCSS.MATH.F-IF.1

Understand that a function from one set (called the domain) to another set (called the range) assigns to each element of the domain exactly one element of the range. If f is a function and x is an element of its domain, then f(x) denotes the output of f corresponding to the input x. The graph of f is the graph of the equation y = f(x).

CCSS.MATH.F-IF.7.a

Graph functions expressed symbolically and show key features of the graph, by hand in simple cases and using technology for more complicated cases.★

  1. Graph linear and quadratic functions and show intercepts, maxima, and minima.

The math concept that is the focus of this picture problem is functions. The math thinking that can take place via this picture problem includes simplifying, analyzing patterns, and synthesizing the information followed up by representing the information in a variety of ways. For starters, the student can simplify what is represented in the picture. They can pull out the numbers and then they can realize from the mystery machine that they will be evaluating a function. They can analyze the pattern between the numbers that will give them the equation of the function. Then they will represent their synthesis of the information in a variety of ways including a table and a graph. Their processes will be evaluating the given number and coming up with an equation for it. Then they will have to determine the graph from either the points or the equation.

The picture brings relevance because in this unit students have been learning about functions and the curriculum will frequently use the concept of a function machine to describe how each input has only one output. As students are already familiar with the concept of a function machine, so bringing in a physical model such as the Mystery Machine Function Machine or even the above photo of the Mystery Machine Function Machine will be very relevant to what they are learning. As for engagement, this will also get students engaged because they will have to take what is supplied in the photo and compile it into a table, establish what the function is and then graph it. Teachers can put the picture on the board and then ask the students to do what they think they should do with what is supplied in the picture or the teacher can give them explicit directions.

Using Lines to Solve Systems CCSS.Math.HS.A-REI.6


The picture above was created using Desmos, a free to use graphing application. I created this imagine to use in a lesson about solving linear systems. I wanted an image that students could easily recognize and create equation from. The picture can be aligned with CCSS.Math.HS.A-REI.6, “Solve systems of linear equations exactly and approximately (e.g., with graphs), focusing on pairs of linear equations in two variables.” The picture can be used in a task that has students find equations for the lines and finding the ordered pair for the intersection. Students can then find a think about a way to find the ordered pair algebraically.

The picture is a nice starting place for this learning. It gives students a visual representation of the solving systems concept, and it has students build up from what they already know.

Here is the lesson plan and associated worksheet for the picture above.

This is for squares SSE.4

This picture could be used in a problem concerning geometric series, such as, find a formula to represent the area of the first 3 sequences in this diagram. The Common Core State Standard that aligns with this type of problem is CCSS.Math.A-SSE.4, which involves students using the formula to sum a finite geometric series.

The mathematical concept is related to mathematical process because the students need to know how to find the area of a triangle and then apply this information to find a formula to represent the area of a triangle that is being halved in each consecutive sequence. This is also connected to mathematical reasoning because the students must be able to think about what is happening to the dimensions of the triangle if the area is being cut in half with each new term; therefore, the students must be able to use mathematical reasoning to conclude what is happening in order to derive a mathematical equation that represents the geometric series.

Cutting, Doubling, Food for All 6.RP.A.2

CCSS.MATH.CONTENT.6.RP.A.2
Understand the concept of a unit rate a/b associated with a ratio a:b with b ≠ 0, and use rate language in the context of a ratio relationship. For example, “This recipe has a ratio of 3 cups of flour to 4 cups of sugar, so there is 3/4 cup of flour for each cup of sugar.” “We paid $75 for 15 hamburgers, which is a rate of $5 per hamburger.”


I’ve always thought pictures that showed food split in half that shouldn’t be able to be split was super interesting so I believe this would be great way to get students interested and talking at the beginning of class. It allows the students to explore what they could possibly be learning about before they are thrown into word problems. From there, it can be used to talk about ratios and fractions of food.

They will be able to find the proportion between different groups of food and the cost and find the rate for a single bit of food and apply that to making sure there is enough money to pay for a large group of people. They will also be able to compare the ratios within a given recipe. As a teacher, I would have numbers that worked well in different sizes as they begin so that the students can apply them to interesting things that they want to be working with.