Pizza Party Problem 8.FB.4&5

How many pizza topping can we afford?

yummy pizzaThis is a modeling lesson designed for 8th grade students based around linear function concepts. It aligns with the Common Core State Standards CCSS.MATH.8.F.B.4 and 8.F.B.5, as well as the mathematical practice standards MP.4- Mathematical Modeling. Students are asked to create linear function models and graphs and use them to solve the essential question of how many pizzas and ingredients they would choose for a party with a limited amount of money.

Pizza party problem group lesson plan

Functions of Pokemon CCSS.MATH.CONTENT.8.F.B.4


Functions of Pokemon


pokemon

This lesson is an exercise in the practice of creating algebra equations to model a recently popularized activity of the app game Pokémon Go. In this activity, students will create a generalizable linear model and justify both the processes to create their model and its validity. The main question is how does the amount of the Pokémon caught effect the amount of stardust? This is our leading question and it connects to all learning targets.

Lesson Plan and Worksheets Pokemon Lesson Plan Group


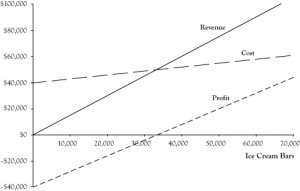
What T-shirt price will make a better profit? 8.F.B.4; 8.F.B.5

profit, cost, loss

This lesson is was created to help students learn how to create and read linear functions. There are 3 common core standards written into the lesson plan. This lesson is originally planned to take at least 3 days to complete. With this lesson we can get students to use their reasoning skills to predict and test how the pricing of t-shirts can result in profit or loss overall.

group lesson plan

group lesson plan rubric

Logging On 8.F.B.4 and 8.F.B.5

Which Internet plan is better?

High-Speed-Internet

During this lesson, students explore linear relationships in real-world problems to determine the best plan for their Internet needs. The lesson relies heavily on student discourse and reasoning in comparing scenarios as well as procedural fluency in creating tables, graphs, and equations to represent data.

Students will receive a brief scenario about someone shopping for an Internet access plan. One plan includes an initial usage fee followed by a constant rate per minute of Internet access. Rather than receiving these rates in the problem, students are expected to find them using a few given data points. Once these rates are found, students will be presented with a new plan that contains different rates and fees. Students will repeat the process (working toward procedural fluency) and compare the two plans. Because this is a modeling activity, students will be largely left alone with their groups to find solutions. The teacher should play a passive role, asking guiding questions and helping students discover new knowledge for themselves rather than lecturing and giving out answers.

Through the practices of modeling and discourse, students will be better able to grasp the concepts in the CCSS content standards. Students are not only expected to solve the problem accurately, but to model the problem using multiple methods and justify their answers using mathematical reasoning. As students work to solve the problem, they will be expected to model their data using an x-y table, a graph, and a linear equation. Students will share their findings with their peers and work together to compare both Internet plans. More discussion will ensue as students decide which life factors will affect their choice of Internet plan (how much Internet a person would use in a month, etc.). These discussions and group-oriented work will help students attain a deeper, more holistic understanding of linear relationships.

The lesson addresses the following Common Core State Standards:

CCSS.MATH.CONTENT.8.F.B.4
Construct a function to model a linear relationship between two quantities. Determine the rate of change  and initial value of the function from a description of a relationship or from two (x, y) values, including reading these from a table or from a graph. Interpret the rate of change and initial value of a linear function in terms of the situation it models, and in terms of its graph or a table of values.

CCSS.MATH.CONTENT.8.F.B.5
Describe qualitatively the functional relationship between two quantities by analyzing a graph (e.g., where the function is increasing or decreasing, linear or nonlinear). Sketch a graph that exhibits the qualitative features of a function that has been described verbally.

CCSS.MATH.PRACTICE.MP3 Construct viable arguments and critique the reasoning of others.

CCSS.MATH.PRACTICE.MP4 Model with mathematics.

Follow our lesson plan here: Modeling Linear Functions Lesson Plan.

By Brittany Stevens, Samantha Hibbard, Juliana Golding, and Bill Munson

Cell Phone Companies Modeling 8.FB4 & 5

Which cell phone plan is the best for me?

mobile-phone-emoji-emoticon-smiley-face-character-talking-happily-cell-60365046

In this lesson, students are given a scenario that requires them to create a linear equation, complete a table and graph the function. The problem presented to the students is as follows: I am sorry to inform you, but your parents have decided to take you off their cell phone plan. Three cell phone plans are provided to different groups in the class. Students are to work in small groups to create their equation, after which they move to larger groups to construct a poster to present to the class. After working in large groups the class will come together and discuss all three cell phone equations and compare. Finally, students will individually decided which cell phone company fits their lifestyle and justify their conclusion. In this activity students will model with mathematics and create linear equations through an interactive activity that appeals to their age group.

Cell Phone Company Lesson Plan

How Many Cups Does it Take? 8.FB.B

styrofoam1

In this lesson, students are given the task to determine the number of cups needed to reach the height of their teacher. The only information given is the height of the teacher and the height of one Styrofoam cup. Students are to work with a partner to determine the number of cups with only the materials of four cups, a ruler, and their math journals. Once the number of cups is calculated, the next step is to come up with a linear equation to model what the students discovered. This interactive activity focuses on modeling and creating linear equations in an engaging way that challenges the minds of the students.

How Many Cups Does it Take

I Have a Dream – 8.FB.4&5

Are we any closer to equality than we were in 1963?

The civil rights leader Martin Luther KIng (C) waves to supporters 28 August 1963 on the Mall in Washington DC (Photo: AFP/Getty Images)
The civil rights leader Martin Luther King Jr. waves to supporters 28 August 1963 on the Mall in Washington DC (Photo: AFP/Getty Images)

Content and Practice Standards:
CCSS.Math: 8.F.B.4
CCSS.Math: 8.F.B.5
MP 4 – Model with mathematics.

Central Focus and Purpose:
Through experiment in mathematics and culture we will explore data in a series of graphs and evaluate whether we as a society are any closer to equality in the time that has passed. Students create models of linear functions and learn to recognize nonlinear function. They will find the slope of a linear function and evaluate what it means in terms of the economic, education, and social data in the interactive activity to determine whether we are any closer to equality.

Targets and Plan for Intended Learning:
Students will be able to calculate the rate of change and use the rate of change to interpret data in real-life graphs. Students will also be able to estimate a linear function over top of a graph that may not be perfectly linear.

Materials and Technology Needs:
For this assignment we will be using the classroom computer and projector to view short videos as well as read an article as a class. Worksheets for every student to complete (plus a few additional), calculators, pencil, and erasers. Students will be able to use the graphing calculator with the help of the teacher to find a line of best fit when appropriate to check their models.

Assessment Strategies:

  • The teacher will observe groups and look for possible student misconceptions to assure students are understanding what a linear function is and how to find the slope and ensure there are no problems caused by students making assumptions.
  • Help students with defining their variables correctly and answering the questions asked of them.
  • The teacher will ask groups to present their ideas and interpretations of the data. Other groups will be asked to comment and make connections to the material. Students must demonstrate they constructed a linear equation, and solve for the slope of the line.
  • Formative assessment will be the teacher’s evaluation of the written responses that are submitted at the end of class as well as their observations during the assignment. Students must show critical thinking and math reasoning. They must show a linear equation and evaluation of the line for its slope.

Relevant Multimedia Links:

A Half-Century After the March on Washington, Would King Be Satisfied? (Article).

“I have a dream” Martin Luther King Jr. the March on Washington (Short Version YouTube).

Graphical slope of a line | Linear equations and functions (Instructional Material YouTube).

Graph Shop – Graphing Lines Thrift Shop Parody (YouTube).

Lesson Plan and Materials:

Lesson Plan I Have a Dream.

I Have a Dream – Worksheet.

Graph Data for Lesson I Have a Dream.

Modeling a Digital and Global Age Learning Environment

Modeling a Digital and Global Age Learning Environment


Over the past decade our world has become increasingly more dependent on technology. Some school districts have made an effort to bring more technology into every classroom, but it is time for teachers to include technological tools in each of their lessons to assist each of their students’ needs. There are tools that can be used in the classroom such as clickers, smartboards, and document cameras. There are also so many web based resources that teachers can use in the classroom and that students can use at home, given they have internet access. Teachers need to take the time to be trained in technological tools that can improve their students’ learning environment and many will quickly find that these tools assist many of their teaching strategies.

Class Website

             A class website is a great communication tool for teachers, their students, and the students’ parents. My website includes a unit calendar that includes daily homework and quiz/test dates. Parents and students can check the website each evening to make sure all homework is being completed and to be made aware of future assignments. My website also includes links to online textbooks, helpful math websites and websites that provide fun games for extending each of my students’ mathematical skills. Many schools have web address set up for each teacher or more personalized websites can be created on KompoZer which is available for free download.

Math is Fun

Math is Fun is a resource website that makes learning mathematics fun and easy. The site covers k-12 curriculum and provides definitions and procedures for solving all types of math problems. This is a great review website as well as a resource for double checking equations and methods for solving problems you are not 100% comfortable with. This online website can help students complete their homework if they forget any needed equations and it can also help parents help their children. It is no secret that many parents have difficulty helping with their child’s math homework past the elementary years; this website will help parents quickly review some concepts and procedures and further their ability to help with homework.

Khan Academy

Khan Academy is another math resource website. This website is excellent for students who learn by example. There are 2-3 examples for each topic that begin with video instruction showing step by step procedures to solve a problem. After video examples there are practice problems that have to be correct before moving forward but also hints to help. My students love Khan Academy and many times when I know I will have a substitute I have them show the Khan Academy video as opposed to teach a lesson to my students. On my website I update the Khan Academy link to go directly to our current topic page.  This resource along with the textbook website, which also has instructional videos, is usually enough instruction for my advanced students to keep on top of work when they miss class. This allows me to not have to take time away from other students to teach students who were absent. For some of my struggling learners it is expected of them to review lessons on Khan Academy each evening because hearing the information twice greatly improves their success.

GeoGebra

When my students enter the geometry unit we spend a lot of time on laptops or in the computer lab. I have found that geometry is one of the toughest units for young middle school students to comprehend because it involves so much more than they are used to dealing with at one time. GeoGebra is a great resource for all students, but especially those who are just beginning their journey through geometry. My students use GeoGebra, which is an online resource that can help students create shapes and find their measurements. Students have difficulty with relationships between shapes and remembering differences between area and perimeter. GeoGebra helps students, especially visual learners, actually see what area means vs perimeter. I have GeoGebra linked on my class website so students can have quick access to it at home.

With an ever changing world technology allows teachers keep their lessons and students up to date with the latest mathematical tools. Providing students with the knowledge of how many resources are online and available for help with homework will make students more interested in completing their homework because going online and searching through websites is fun for young adolescents. It is important for teachers to be able to make the transition from paper and pencil, to online tools, and then back to paper and pencil. Resources such as GeoGebra are wonderful for helping students gain conceptual understanding of abstract concepts, but the procedures that are needed to solve problems without the help of technology cannot be forgotten. Students will be taught what a good digital citizen is and the importance of this will be reminded to students whenever we go online as a class. I will model each resource for my students before I expect, or encourage them to use it without my supervision. Trusting my students to make good choices usually makes them want to keep that trust and I rarely come across problems with online resources.


Resources

KompoZer

http://kompozer.net/

Math is Fun

https://www.mathsisfun.com/

Khan Academy https://www.khanacademy.org/

GeoGebra

https://www.geogebra.org/

Digital Citizenship

http://www.digitalcitizenship.net/Nine_Elements.html

Picture Problem: Potato Chips

o-CRISPS-570 p0376182 potato-chip-taste-test_612


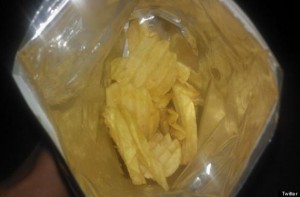
People are often frustrated with the amount of chips that come in a bag of chips. Or lack thereof.

For this activity, students will find out the average amount of chips found in bags of chips. They will then find the average size of a chip, and the amount of space that a chip bag can hold. From there, they will figure out how many chips could fit in bags if companies filled them up, and compare that to how many they actually put in the bag.

Example: Lays potato chips. Out of x amount of bags, they hold an average of y amount of chips, filling z% of the bag. Therefore, if they filled the bag, they could fit a amount of chips.


They could complete this through proportions

CCSS.MATH.CONTENT.7.RP.A.3
Use proportional relationships to solve multistep ratio and percent problems.

or geometry, using surface area and volume

CCSS.MATH.CONTENT.7.G.B.6
Solve real-world and mathematical problems involving area, volume and surface area of two- and three-dimensional objects composed of triangles, quadrilaterals, polygons, cubes, and right prisms.

Taylor Swift on Twitter 8.F.A.1

twitter logoHow many Twitter followers does Taylor Swift gain every day? How many followers will she have next Friday if she keeps up the same rate?

Social media is everywhere in today’s society, especially for young people. Incorporating social media into a math lesson can be incredibly beneficial to student engagement and interest because social media is so embedded in teenage culture. In this activity, students monitor a popular celebrity on Twitter (or Instagram, Facebook, etc.) by recording how many followers he or she has each day. Students will record this data for several days and use these data points to create a scatter plot on the coordinate plane. After several days, students will be able to analyze the graph, identify trends, and maybe even use a linear model to estimate future values.

For this example, I chose to follow Taylor Swift because she is relevant to young adolescents, has a significant social media presence, and is generally appropriate in the content she posts (this last reason is very important!). If you would prefer to make this a one-day activity rather than a several-day process of collecting data, you can find existing data points at websites like Twitter Counter. However, the process of looking up new data each day and predicting new quantities is deeply valuable for student understanding and investment in the activity.

This lesson addresses CCSS.MATH.CONTENT.8.F.A.1CCSS.MATH.CONTENT.8.F.B.4, and CCSS.MATH.CONTENT.8.F.B.5 in the Common Core State Standards for Math. The lesson also addresses GLE 1.1.2 in the 6th-8th Grade Washington State Standards for Educational Technology.