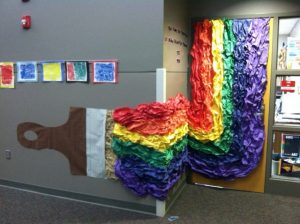
Perfect Purple Classroom! 6.RP.A.3

CCSS.Math.Content.6.RP.A.3
Use ratio and rate reasoning to solve real-world and mathematical problems, e.g., by reasoning about tables of equivalent ratios, tape diagrams, double number line diagrams, or equations.

CCSS.Math.Practice.MP4 Model with mathematics.

CCSS.Math.Practice.MP5 Use appropriate tools strategically.

CCSS.Math.Practice.MP3 Construct viable arguments and critique the reasoning of others.

Lesson objective: I can create a model that shows how two values compare to one another.

This is a real-world activity to introduce proportions and ratios. This activity allows students to see that proportions are not just something you see on math worksheets, but in everyday life. This lesson relates to the fine arts, which helps culturally diverse students learn the mathematical concept better. Fine arts such as painting has been known to express complex cultural issues and their heritage has been translated into exchangeable value. The intuitive need for students to express themselves is precisely why the arts are an ideal vehicle to develop language, deliver content, and encourage academic exploration in school in culturally responsive ways. Learning, communicating, and questioning in alignment with the arts develops a dynamic classroom environment where students are excited and engaged in this process. Therefore, integrating arts into learning results in a more engaging classroom for students of all backgrounds.

This activity relates to all students as we are talking about physically painting our classroom once students have accurately problem solved how to paint our classroom the perfect purple. In order to create the perfect purple color, we must need the perfect mixture: two cups of blue paint and three cups of red paint. After measuring our classroom, we decided we need a total of 35 cups of our perfect purple paint to coat the walls. Students will be given the opportunity to work with their peers and with manipulatives to decide how much of each color would be needed to make a total of 35 cups of perfect purple paint. The manipulative provided will be interlocking colored math cubes that the students can build the proportion of the ratio for every three cups of red there needs to be two cups of blue. Once students have had an opportunity to work through the problem using just the interlocking colored math cubes, their peers, and teacher as support, then students will present their ideas to the whole class. As the teacher guides this whole class discussion, the students and teacher will come to the conclusion of the correct amount of blue and red paint needed to create the perfect purple to paint our classroom.

Student Handout: MATH 325 perfect purple paint
Laser-Tag-Mania! CCSS.MATH.CONTENT.HSA.CED.A.1 andCCSS.MATH.CONTENT.HSA.CED.A.2

The story problem is about a game of laser tag where you have a certain amount of life points and you lose an amount of life points every time you get shot. The students will work in groups and as a group they will decide what they want their life point to be and how much will be lost per shot. Once they have decided that they will come up with an equation to model the situation. After they have their equation they go onto Geogebra and use it to graph their equation. Then each group puts their equation and graph on the white board and as a class we have a discussion about which equation students think would make the best game of laser tag and why.

CCSS.MATH.CONTENT.HSA.CED.A.1

Create equations and inequalities in one variable and use them to solve problems. Include equations arising from linear and quadratic functions, and simple rational and exponential functions.

CCSS.MATH.CONTENT.HSA.CED.A.2

Create equations in two or more variables to represent relationships between quantities; graph equations on coordinate axes with labels and scales.

LaserTagLessonPlan and Worksheet

To Infinity and Beyond CCSS.MATH.CONTENT.8.G.A.1 (A.B.C.) and 2, MP1 & 4

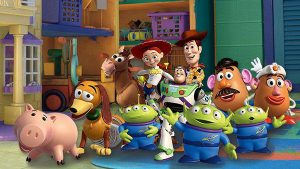
Are you ready to work for Pixar? To Infinity and Beyond is a technology-based math activity in which students interact with scenes from the famous Pixar movie, Toy Story. During this activity, students will be using their math skills such as translation, rotation, and scaling, to reconstruct scenes from the movie, in order to get approval from the director. Once the scene has been approved, the students can continue their learning, by answering the challenge questions after each section.

Attached below: Lesson Plan, and Student Worksheet

This lesson aligns with the the Common Core State Standards, the ITSE Standards, and the Math Practices:

CCSS.MATH.CONTENT.8.G.A.1 (A.B.C.) – Verify experimentally the properties of rotations, reflections, and translations: (A) Lines are taken to lines, and line segments to line segments of the same length. (B) Angles are taken to angles of the same measure. (C) Parallel lines are taken to parallel lines.

CCSS.MATH.CONTENT.8.G.A.2 – Understand that a two-dimensional figure is congruent to another if the second can be obtained from the first by a sequence of rotations, reflections, and translations; given two congruent figures, describe a sequence that exhibits the congruence between them.

CCSS.MATH.PRACTICE.MP1 –  Make sense of problems and persevere in solving them.

CCSS.MATH.PRACTICE.MP4 – Model with mathematics.

ISTE (3) Knowledge Constructor – Students critically curate a variety of resources using digital tools to construct knowledge, produced creative artifacts and make meaningful learning experiences for themselves and others.

ISTE (6) Creative Communicator – Students communicate clearly and express themselves creatively for a variety of purposes using the platforms, tools, styles, formats and digital media appropriate to their goals.

Group Project for Blog – Google Docs

To Infinity and Beyond

What’s Your Shape? CCSS.MATH.CONTENT.6.G.A.3


This is an interactive activity using the app Geometry Pad to solve the essential question: What shape do these coordinates make? This activity consists of students working with their peers to determine what shape they have based on simple coordinates. Students will present their prediction and justify the reasoning. To confirm the shape, they will use the app Geometry Pad under the document camera in front of their peers.

To find this app, visit the Apple App Store and search Geometry Pad. This app is only available on iPad.

Here is a sample lesson plan that applies this activity in a 6th grade class. Math 325 Math Blog Tech Lesson Plan

CCSS.MATH.CONTENT.6.G.A.3 Draw polygons in the coordinate plane given coordinates for the vertices; use coordinates to find the length of a side joining points with the same first coordinate or the same second coordinate. Apply these techniques in the context of solving real-world and mathematical problems.

Modeling with Technology: GeoGebra-Fication…Oh My!: CCSS.MATH.CONTENT.5.NF.B.4

Image result for geogebra fraction grid multiplicationTechnology Modeling Better Math Blog

The attached activity helps students understand how to multiply fractions together with the help of a grid model. The students will use the GeoGebra app to demonstrate two fractions and how they can be combined in a grid. This lesson will help students visualize fractions and also visualize a multiplication problem. The teacher will introduce the GeoGebra App (https://www.geogebra.org/m/RqRdUusq) and walk the students through how to solve a problem on this app. The teacher will also explain what the solution represents using the GeoGebra App for examples.

The students will have the opportunity to become familiar with the app by generating and solving their own problems. This time will be dedicated for the students to learn the app and ask any clarifying questions they may have about the app or about the problems in general. This lesson will also have the students model the multiplication problems through drawing as well. Viewing the grid product of the problem and then drawing the product will help students solidify the connections between the two original fractions as well as the product.

This lesson can be extended upon by having the students draw their own grids without the help of the app. They can start out by making the box that is up and down as the first fraction. Then the students would draw the next fraction by imagining a new blank box that goes side to side and then it would slide on top of the first fraction. This will help the students learn about creating the grid and how big the grid should be. The students can also use this app to check their work and visualize a grid representation of a fraction.

Where Do We Meet? REI

screen-shot-2016-12-02-at-12-47-21-pm

WHERE DO WE MEET?

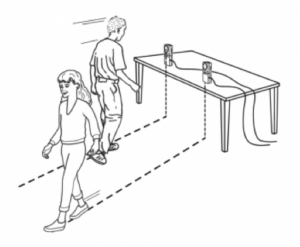
Where do we meet is an interactive activity that uses technology and mathematical concepts to create and solve real life scenarios. One of the Vernier products to compliment this lesson is the Motion Detector. This device allows for data to be collected through a calculator (or a computer software) where students can then analyze their findings. For this activity students will be able to see a real life scenario of the usage of the mathematical concept of Solving Systems of Liner Equations using a motion detector, calculator and themselves. In this activity, students will be able to part of the creation of data that will be used to create equations. Students will then take part in solving the system of equations using technology and on writing (mathematically). Students will be able to use this activity that ties to the following Common Core State Standards:

INQB.2 Collect, analyze and display data using calculators, computers, or other technical devices when available

APPD.2 Use computers, probes, and software when available to collect, display, and analyze data.

M3.2.H Formulate a question that can be answered by analyzing data, identify relevant data sources, create an appropriate data display, select appropriate statistical techniques to answer the question, report results, and draw and defend conclusions.

H.A.REI.1– Explain each step in solving a simple equation as following from the equality of numbers asserted at the previous step, starting from the assumption that the original equation has a solution. Construct a viable argument to justify a solution method.

H.A.REI.2– Solve simple rational and radical equations in one variable, and give examples showing how extraneous solutions may arise.

H.A.REI.5– Prove that, given a system of two equations in two variables, replacing one equation by the sum of that equation and a multiple of the other produces a system with the same solutions.

H.A.REI.6– Solve systems of linear equations exactly and approximately (e.g., with graphs), focusing on pairs of linear equations in two variables.

vernieractivity-wheredowemeet

Deriving Quadratic Models From Gathered Data: Building Functions F-BF

video-tape-lesson-325-28htqwx

Above is a link to a lesson plan I created revolving around the use of modeling and technology. The technology uses are stop watches and video recorders. The main technology focus is the use of the video recorders where students will use them to document their work. Students will create models during the activity which will represent the data collected from their experiments of dropping bouncy balls and calculating time between two bounces and the max height in between those two bounces. If stop watches are not available then you can measure the distance between the two bounces instead.

The Population Pandemic HSF.LE.A1

Image result for population graph

As the modern medicine and effective food methods become increasingly efficient, humans are able to populate more and more of the Earth. However, as we approach a net population of just over 7 billion and the Earth only holding a population threshold of over 12 billion, we must ask ourselves how long do we have before we overcome Earth’s population threshold?

With the help of a trusty TI-83 calculator teachers and students alike can find the answer to that question and more. Just follow the link lesson plan below to start an interactive and real-world activity that the students are sure to find relevant and engaging.

modeling-activity-lesson-plan

Battleships and Mines HSG.GPE

screen-shot-2016-10-26-at-12-53-10-am

What better way to learn math than by playing Battleships and Mines!!!

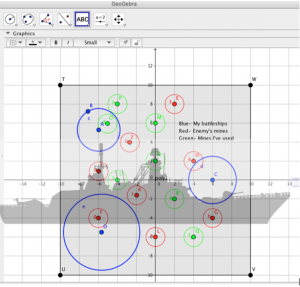
This interactive activity will indulge your students into creating their own battleships and mines using geometry. Students will generate their battleships and mines using equations of circles that will be graph using GeoGebra. GeoGebra is a free and useful software where students can create circles with just two clicks! No more “I do not want to graph this!” With GeoGebra students will be able to fully engage in the activity while practicing the properties of the equation of a circle, without the hassle of graphing it. GeoGebra not only does it have functions that can be incorporated with algebra and calculus curriculum, but it comes at no cost to schools, teachers and students.

battleships-lesson-geometry-m325


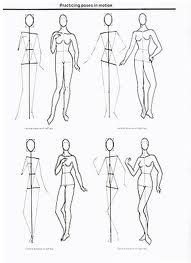
Fashion Drawing vs. Real Humans CCSS.MATH.8.F.B.4 & 5, MP4

Blog Image

This is an 8th grade modeling lesson aligned with linear function models and graphs. Are the fashion artist’s proportions right? This activity challenges students to analyze body proportions generated by a fashion illustrator, then compare them to the student’s own specific body proportions. Students will collect data into a table, plot it onto a graph, and generate an equation to determine the accuracy of the fashion illustration’s proportions.


Fashion Proportion vs Human Proportion