Student-Applicable Modeling Lesson HSS.ID.6.A

screen-shot-2016-10-25-at-11-11-27-am

This lesson is focussed on having students find a regression to best fit a set of data of homework scores and test scores of pervious years. This lesson requires students to focus on modeling their findings graphically, use technology of an advanced graphing calculator, and answer prompts to promote deeper thinking of their findings.

To view this lesson, click the link below:

homework-and-test-score-correlation-lesson


Modeling Systems of Equations fun with GeoGebra: HSA.CED.A.1

geogebra-demonstration

GeoGebra is dynamic mathematics software for schools that joins geometry, algebra, and calculus.  This software is a fantastic tool for students of all ages. For this lesson plan, I incorporated the topic of solving linear systems of equations using the benefits of having GeoGebra. I had students work through the process of graphing the systems of equations by hand but had them use the tool to check their work for them to have instant feedback. This allowed students to check their models and provided them with an instant model of what their systems should look when graphed. I also included a challenging problem where the students worked with a system that included a quadratic equation. This was something for the students to think about since we had only been working on linear equations. Using GeoGebra provided a great model representation of this particular system and allowed the students to see that a system could include more than linear equations. Throughout this activity I also had students work on creating their equations given points to work from to allow for deeper thinking.

modeling-activity-complete

Math seen around the world

realworldmath

Are your students continually complaining, “When will I use this?” (referring to math concepts) Look no further than Realworldmath.org, where teachers can find pre-existing lessons on math in the real world utilizing Google Earth. Students can work independently on projects, developing problem solving skills and practicing content learned in their math classes. If a teacher wants to get real fancy, they can even create their own unique lesson using the tools that Google Earth offers.

Math seen in the REAL WORLD

Modeling a Digital and Global Age Learning Environment

Modeling a Digital and Global age Learning Environment

Brittany Moore

Bolded words are linked to sites!

Technology is even more present in our world than ever, and a very large part of our students’ daily lives and in how they see and interpret the world around them, so it only makes sense that it is incorporated into their standard learning regimen.

Web 2.0 refers to the new stage in development in the World Wide Web that allows users to interact with webpages rather than just use them as a source of information. This is a wonderful opportunity for teachers and should be taken advantage of.

There are many new ways for teachers to connect and share ideas, which they can use to create new lessons and gain new teaching strategies or to find ideas to supplement their already tried and true methods. Teachers may also find this helpful to help students who are struggling and not grasping the concept the way the teacher is teaching it. Many teachers think of Pinterest pinterestwhen they think of turning to the internet to find creative lesson ideas, but would you have thought to look at Scholastic for interactive math lesson ideas? They even have some awesome tips for integrating technology into your classroom.

You have used technology find ways to enhance your lesson, now how can you present this information to your students in a way that uses the technology to make it fun and interesting? Rather than standing at the front of the room lecturing, one go to form of presentation is the Prezi, an interactive slideshow presentation that is customizable to your presentation. Now, a slideshow presentation may seem like a difficult or dull way to learn math, but this Prezi about the number system provides an amazing visual for students.

https://prezi.com/n-8ibkiw881r/number-systems/

Prezi can be accessed for free, but creating a free presentation allows Prezi to add it to their database for other users to search and view or use, which can also be a helpful way for teachers to find new ideas or ways to present topics. This could be an example to students about how to be responsible about what they post because once it’s online it stays online forever, and also to discussions about plagiarism the consequences of taking someone else’s work to pass it as your own.

Other sites that can be extremely helpful, Desmos Graphing Calculator is not only an extremely useful resource for students, it also has pre-programmed examples under the tab on the left side and allows sliders to be able to plug in variables into generalized formulas.

Screen-Shot-2012-12-08-at-8.01.45-PM

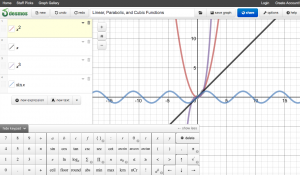
This could be used as a modeling exercise during instruction. A teacher could even project the graph or lines up onto the whiteboard and mark points or lines on the perfectly projected graph rather than having to draw the axis and try to guess while plotting points, this will make it easier for students to see exactly where points are. This is also a helpful resource for students when they are at home they can access the examples. Desmos is also available as an app on all devices and could be used as a support or accommodation for students who may have difficulties with fine motor function and are unable to graph on paper.

One way that utilizes technology and makes assessment fun for students is Kahoot!, a survey type quiz program that allows students to use their phones or computers to answer questions projected onto the board. Students receive points for their answers correctness and then the speed of their answer. This can be a fun formative assessment as well self assessment for teachers and students to gauge the students’ understanding of the topic and determine what materials need more focus or review.

Keep It Warm or Cool It Down HSF.BF.A.1.B

Keep It Warm or Cool It Down

Making connections between content areas is an important to our understanding of the concepts. This lesson would be ideal in an 8th grade algebra class where students also taking physical science, or in a high school algebra or functions class if students are taking physics. If students are not taking a physical science class and/or have not gotten to the topic of conductors this lesson can still be done with a limited understanding of the physics content. This project would take place during the a segment on exponential functions.

Standards for this project:

CCSS.MATH.CONTENT.HSF.IF.C.7
Graph functions expressed symbolically and show key features of the graph, by hand in simple cases and using technology for more complicated cases.*

CCSS.MATH.CONTENT.HSF.BF.A.1.B
Combine standard function types using arithmetic operations. For example, build a function that models the temperature of a cooling body by adding a constant function to a decaying exponential, and relate these functions to the model.

CCSS.MATH.CONTENT.HSF.LE.B.5
Interpret the parameters in a linear or exponential function in terms of a context.

CCSS.MATH.PRACTICE.MP4 Model with mathematics.

CCSS.MATH.PRACTICE.MP2 Reason abstractly and quantitatively.


General Equipment:

  • Vernier Temperature probes
  • Computers with Logger Pro

Vernier_EasyTemp_large

OR

  • Vernier Go Wireless Temperature Probes
  • Go Wireless Temp App for Ipad or other tablet
  • Aluminum soda can for each group
  • Boiling or VERY warm water


Specific Equipment:

  • Student chosen method of insulation/cooling for their can.


The Project

Students will be placed into an even number of small groups or pairs, half of the groups will be tasked with cooling the hot water in their cans to room temperature as quickly as possible and the other half will be tasked with keeping their water from cooling to room temperature as long as possible by only altering the environment outside of the can. Students will use their knowledge/minimal research to come up with plans in their groups and have the next day or two to prepare outside of class with their group gathering supplies, or building their cooling or insulating apparatuses.

Once the cans are prepared the instructor will pour very hot water into the cans, and students will put in the temperature probes. Have every group start recording their data and when the temperature cools to 90°C so all starting temperatures are the same. While students are doing this, allow a control, just a plain can to be going at the same time. Students will have a graph of their temperatures, and will need to find an equation to model their equation.

LoggerProMain

Students can write their equations on the board and use reason and their knowledge of exponential functions to determine the order that the groups cans cooled to room temperature. The functions can then be graphed together to model and compare the rate of cooling for each groups’ can.

Stainless Steel Temperature Probe

Vernier Logo

Volume in Sports


balls

Mens Basketball diameter 238.8mm

Soccer ball 110mm

Volleyball 105 mm

Baseball 37mm

Cricket 36mm

Tennis 33mm

Golf 12.35mm

Squash 20mm

Most sports throughout history have been played with some manipulated object, and most popular of all, is the ball. The object of this activity would be to compare the volumes of a variety of different sports balls. We can find the ratios between the different sized sports balls and find equations to represent the relationships between their volumes.

volume

For example, the volume of a soccer ball is 5575279.67mm3, and the volume of a squash ball is 33510.3mm3, and the ratio of squash balls to soccer balls is 116.375:1, or perhaps that a soccer ball could hold 116 squash balls (theoretically).

We could also find equations of how many golf balls and squash balls combined would fit into a basketball

(x*Vsquash)+(y*Vgolf)≤Vbasketball

  CCSS.MATH.CONTENT.8.G.C.9

Know the formulas for the volumes of cones, cylinders, and spheres and use them to solve real-world and mathematical problems.

Making HATS HSA.REI.B.4


Alignment to Content Standards

  • MATH.CONTENT.HSA.REI.B.4 Solve quadratic equations in one variable.
  • MATH.CONTENT. HSF-IF C.8  Interpreting Functions: Analyze functions using different representations.
  • MATH.CONTENT.8.F.B.5 Describe qualitatively the functional relationship between two quantities by analyzing a graph (e.g., where the function is increasing or decreasing, linear or nonlinear). Sketch a graph that exhibits the qualitative features of a function that has been described verbally.

Task

The cross section of a hat can be modeled by the following polynomial function:  

y=(1/27)(x-15)(x+15) where x and y are measured in cm. 

Given these facts, answer the following questions and be sure to show your work:

Note: sketch graph in your work.

  1. How wide is the hat (not including the bill)? Hint: we are looking for the diameter.
  2. Measurement of the Crown? Hint: Think of the lowest point in a parabola.


The IM Assessment, IM Assessment Commentary, and solution is attached:

IM Assessment (Commentary & Solutions included)

7.G.B.4: Delicious Math

Even when writing essays, humor is frequently used as an attention grabber to engage readers and to put them in a positive mindset for reading the rest of the essay. This idea also applies to engaging students in the math classroom. The pictures featured in this blog includes many different possible math applications.pizza mathimportant math


One such problem is using different shaped and sized pizzas to determine surface area and perimeter, and to improve comparison and mathematical reasoning skills. A common math problem requires the students to compare the size and price of a circular pizza to the size and price of a square and/or rectangular pizza. This will have the students calculate the surface area of each pizza and compare them to see which one is larger. Next, the students will have to compare the prices of each pizza to see which pizza is a better deal. Additionally, you can have the students discover pi by having them compare the circumference and surface area of small, medium, and large pizzas. A couple questions that you can ask the students are:

  • What is the surface area of each pizza?
  • Which pizza is the better deal?
  • What is the circumference of a circular pizza with an area of ____ square inches?
  • If the crust is 1 inch wide, what is the surface area of the pizza excluding the crust?
  • If the pizza has an average of 4 pieces of pepperoni per square inch, how many pieces of pepperoni are on each of the pizzas?
  • What is the ratio of circumference to surface area of the circular pizzas? Why is that number familiar?
  • To have the students show examples of their reasoning skills, you can ask them to explain how they got their answer for any of the problems just listed.

To further engage the students, you can actually order the pizza and have the students perform their calculations on actual pizzas and then let them eat the pizzas.

There are many common core state standards that you could teach through a pizza lesson, but the following standard is the one that fits the activity described above.

CCSS.MATH.CONTENT.7.G.B.4
Know the formulas for the area and circumference of a circle and use them to solve problems; give an informal derivation of the relationship between the circumference and area of a circle.

Trick Photography HSG.MG.A.1. and HSG.SRT.B.5

picture

Optical tricks often intrigue us. In reality a little math can often explain exactly why they work. In the picture above the only math needed to figure out how far one must stand from the Lincoln Memorial in order to view the real life figure and the picture on the bill as the same size is triangle similarity and manipulation of proportions. One must also know how tall the real memorial is, how large the picture on the $5.00 bill is, and how far they are holding the bill from their eyes. The following is a diagram of the similar triangles that can be used to calculate how far you are from the Memorial where the bill and the memorial are Parallel:

triangle

This problem satisfies the CCSS’s HSG.MG.A.1. and HSG.SRT.B.5 which are, “Use geometric shapes, their measures, and their properties to describe objects,” and “Use congruence and similarity criteria for triangles to solve problems and to prove relationships in geometric figures,” respectively.


A.CED-Using Pictures to Give Context to Math Lessons

Many students ask, “When am I ever going to use this math?” and many more are thinking the question.  To make our math lessons more relevant and interesting, math teachers need to give lessons real-world contexts.  Using pictures, images, and videos from the internet is a easy way to give math lessons a context outside of the math classroom.

Example: When teaching equations of circles on a coordinate plane, pictures can be used to give a real-world context.

A-CED.A.2. Create equations in two or more variables to represent relationships between quantities; graph equations on coordinate axes with labels and scale.

In many real-world examples, a problem is mathematized by laying a coordinate axis over the real-world figure or picture.  In the 3 examples below, if a coordinate axis over -lays the figures, circle equations can be used to gain information or solve real-world problems:

1. A sports reference, marking the javelin sector on a football field;Javelin sector


2. An art reference, making an art design using circles; andCircle Design


3. Science or nature reference, using circles to study tree rings.
th