Hey! Wait Up!- CCSS.MATH.CONTENT.8.EE.C.8

Oracles-Chasing-DreamImagine you are walking to class and you see your friend up ahead so you run to catch up with him. Can you model this situation mathematically? Of course you can! Assuming that you and your friend are moving at constant speeds, you can set up a system of linear equations. You can model this graphically by plotting distance versus time. If you were to plot the lines on the same set of axes, the point where the two lines cross would represent the physical location where you passed your friend.

VernierCBR2

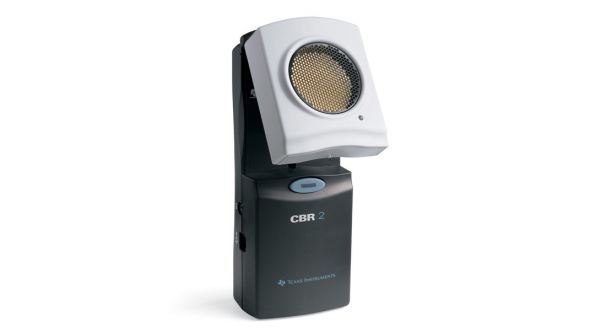
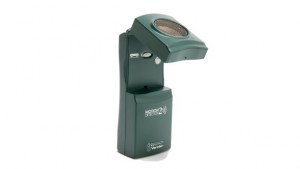
It is possible to create models for situations like this in the classroom using Vernier CBR2 Motion Detectors.

In the Hey! Wait Up! activity, students will work in groups of four: 2 people will be the walkers, 1 person will start the motion detector and operate the stopwatch, and 1 person will mark the point where the walkers intersect. Each group will work together to collect and analyze motion data in order to determine the solution to a linear system of equations using a graphing calculator. They will then check this solution by creating a system of linear equations and solving it by hand. This activity is best done after the students have been introduced  to systems of linear equations and how to solve them.

To complete the The Hey! Wait Up! activity each group will need 2 Vernier CBR2 Motion Detectors (with appropriate cables), a TI83 or TI84 calculator, a meter stick, and a stopwatch.


This lesson aligns with the following Common Core State Standards:

CCSS.MATH.CONTENT.8.EE.C.8– Analyze and solve pairs of simultaneous linear equations.

Screen Shot 2015-10-29 at 12.29.58 PM
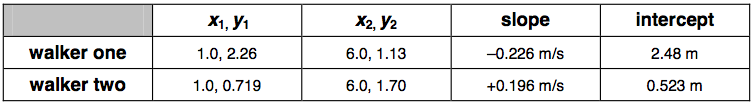
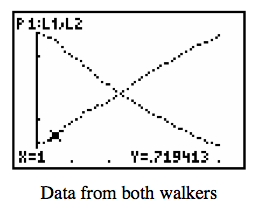
Students will be using the calculator results to find the coordinates of two points for both lines which they will then use to find the slopes of each line. Students will also use the calculator results to find the y-intercept of each line. Using this information, students will be able to create equations for the lines that they will then use to make a system of linear equations and solve.

Screen Shot 2015-10-29 at 12.37.44 PM

CCSS.MATH.CONTENT.8.EE.C.8.A– Understand that solutions to a system of two linear equations in two variables correspond to points of intersection of their graphs, because points of intersection satisfy both equations simultaneously.

At the end of this activity, students will be able to connect that the point where they crossed when walking is the point where the two lines intersect and that this coordinate point is the solution to the system of linear equations.


To conclude this activity, students will be given an exit slip that asks:

  • In your own words, what is a system of linear equations?
  • Give me an example of a real world situation (that does not involve walking/ running) that you could model using a system of linear equations.

From this you can determine and gauge your students’ conceptual understanding as well as see if they can apply the idea of using systems of linear equations to model other everyday experiences.


A benefit of using Vernier Motion Detectors when teaching the concept of systems of linear equations is that it makes the concept personal for the students. It helps bring mathematics out of the classroom and into the real world. Rather than seeing the systems of linear equations as just lines on the graph, they can see that in this situation those lines represent something, namely the students’ walks. This activity also gets the students involved in their own learning by having them get up and move around when they are doing the walking activities and collecting the data. This makes the data concrete for them rather than just some numbers, equations, and coordinates they have to work with in order to find a solution.

Vernier Logo

A Vernier CBR2 Motion Detector costs $99. To buy or to find out more about the Vernier CBR2 Motion Detector visit http://www.vernier.com/products/sensors/motion-detectors/cbr2/

To find out more about Vernier Software & Technology and explore their other products visit http://www.vernier.com/


Hey! Wait Up! worksheet: Hey! Wait Up!-Systems of Linear Equations with Vernier Motion Detectors

Simple Harmonic Motion: HSF.TF.B.5 and HSA.CED.A.2

Simple Harmonic Motion:

harmonic motion pic

The Vernier physics activity titled Simple Harmonic Motion shows students how sinusoidal functions appear in the world around them.

This activity fulfills the following Common Core State Standards:

CCSS.MATH.CONTENT.HSF.TF.B.5
Choose trigonometric functions to model periodic phenomena with specified amplitude, frequency, and midline.*

CCSS.MATH.CONTENT.HSA.CED.A.2

Create equations in two or more variables to represent relationships between quantities; graph equations on coordinate axes with labels and scales.

Students often learn trigonometry but fail to recognize how often it shows up in their lives. Since it seems like all trigonometry is, is playing with triangles and some weird graphs that never actually show up in real life, it is easily forgotten. This lab will help them understand both how applicable trigonometry is and how to manipulate trigonometric functions. This will be done by recording the position and velocity of an object at the end of an oscillating spring using Verniers motion detector in conjunction with a computer that has Logger Pro software on it. The students will experiment with their springs motion when different weights are attached to. A ready prepared lab will lead them though this experiment and help them make connections between simple harmonic motion.

The equipment needed for this activity is the following:

  • computer ring stand
  • rod
  • right-angle clamp
  • Vernier computer interface Logger Pro
  • Vernier Motion Detector spring with a spring constant of approximately 15 N/m
  • twist ties
  • 200 g and 300 g masses
  • wire basket
  • lab worksheet (attached below)

Many of these items can be borrowed from Central Washington University’s CESME department.

PWV-15-COMP-simple_harmonic_motion


Walk This Way – An activity that can be adapted for grades 5-11

The Walk This Way activity uses a Motion Detector from Vernier and TI Calculators to connect student movement to graphical representations.

Notice each of the standards and cluster from the CCSS-Math.   

5.OA.B.3 Identify relationships between corresponding terms.

6.EE.C.9 Represent and analyze quantitative relationships between dependent and independent variables.

7.EE.B.4 Use variables to represent quantities in a real-world or mathematical problem, and construct simple equations and inequalities to solve problems by reasoning about quantitites.

8.F.B. Use functions to model relationships between quantities.

F-IF.A. Understand the concept of a function and use function notation.

A-CED.A. Create equations that describe numbers or relationships.

F-LE.B. Interpret expressions for functions in terms of the situation they model.

The Walk this Way activity includes both Lesson Guidelines and Student Handout.  Walk This Way – Lesson Guidelines

This activity engages students in modeling discourse – Student make and test predictions about graphical models of their classmates movement.

Screen Shot 2015-10-28 at 4.37.33 PMStudents work in groups of four: a. one person walks, b. another operates the calculator, c. another draws the graph on the calculator, and d. the graph of the peers walk, and the final person gives and writes the walking directions.  On the next walk the students switch tasks, so that everyone performs all tasks.
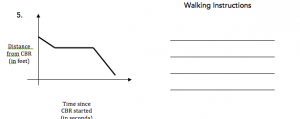
Students perform three different processes of modeling: Part 1. Physically walk from a graph given by the calculator (seen above); Part 2. Physically walk from a graph given on the work sheet (first two activities below); and Part 3. Draw and test a graph when given a walking story (final activity shown).

Screen Shot 2015-10-28 at 4.48.35 PMScreen Shot 2015-10-28 at 4.52.59 PMScreen Shot 2015-10-28 at 4.53.17 PM

Equipments Required

product.md-btd._hero.001.590.332TI- 83 or 84 calculator with Easy Data app (usually comes with the calculator)

Motion Detector from Vernier

Slice It! HSG.MG.A.3


swipe

Using the interactive App Slice it! Students will be playing a highly addictive game that is really just a bunch of geometric modeling problems. This application gives students a geometric figure and tells them to cut it into a given number of pieces, all with equal areas, using a certain number of lines. Sometimes these pieces will be nearly congruent while other times they will look nothing alike. This lesson will prepare students to play the game using mathematics to obtain better scores and will force them to make connections between the algebra they learned in previous years and the geometry they are now working on. Because this application was made for people of all ages, the lesson itself can be altered for a different target audience with ease.

Slice It! can be found in the google play store and in the iTunes store. The lesson plan and worksheet used in this lesson can be downloaded by clicking on the link below.

slice it

CCSS.Math.Content.HSG.C.B.5 – Pizza Party Gone Wrong

geogebra


Geogebra is an incredibly useful tool in the classroom.  Not only does it allow the students to make their own constructions and explore geometry individually, it is also a good application for modeling mathematical concepts.   The numerous in-app tools and calculators gives the teacher an easy to manipulate visual representation that can boost student understanding.

geogbra_3

Attached is a lesson that utilizes Geogebra in a more demonstrative sense.  Students won’t actually get to construct anything on their own, but they will get to see the answer to the question they were working to figure out during the class period.  This lesson focuses on the deriving the formula for sector area, using instructional aid created in Geogebra. There is also an additional Geogebra file that cannot be attached to this post.


PizzaPartyGoneWrongLP

PizzaPartyGoneWrong


CCSS.Math.Content.HSS.ID.B.6 Making Linear Regressions Relevant in the Classroom

resize_image

A question that teachers are constantly asking themselves is how to make math topics relevant in the eyes of their students. And since it seems that the higher levels of math being taught, the less of an issue this seems to be, this issue of relevancy is extremely common in Algebra I and Algebra II classes. Many students have a difficult time relating variables, equations, and algebraic concepts to anything they could ever have to do in the real world. So the question remains, what can you as an educator do to ensure that students see the relevancy of mathematics in the world around them, and how can you all but guarantee that your students can connect each unit of content in Algebra I & II to real world scenarios?


1000px-Linear_regression.svgThe following lesson plan is an example of how one might use real life examples to model mathematical concepts and keep students engaged throughout the entire lesson. This lesson designed to cover scatter plots, positive and negative correlations, and linear regressions uses TI-84 calculators and a Document Camera to model how to find linear regression equations as well as finding correlation coefficients. The following is just one example of how TI-84 graphing calculator can be used to engage students and help them relate algebraic concepts to the real world.


MA325_ModelingLP

MA325_ModelingWS

Orthocenter! Circumcenter! Centroid! OH MY! CCSS.MATH.CONTENT.HSG.CO.D.12

Using Geogebra you can teach your high school student how to explore constructions. In this lesson, students will be given a worksheet and told to make an obtuse, acute, and right triangle of the orthocenter, centroid, circumcenter, and Euler’s line. This will let students have a chance to be creative in math. Since the student will be making their own kind of triangles. It is important to have student explore on there own to find out something and this lesson does just that. Also this lesson can lead into the history of a famous mathematician,  Leonhard Euler.

Euler line worksheet

Euler line lesson plan

HSS.ID.A.1 Turn your Students’ into Mathamagicians

FullSizeRender

Infomercial voice:

Have ever wished your students would jump up from their seats after accomplishing a task and say, “I am a genius?” Have you ever thought while teaching a student, “how can I get him to to understand? I have tried everything.” Well then. I have something for you, but first ask yourself, “what can I do to make my lessons more appealing?” Well ask and you shall receive. Introducing, GraCalc. It is an innovating and captivating calculator. How boring, you say? No Sir. This calculator is packed full of exciting ways to crank out some awesome computation. Not only does its function keys feel glassy and seamless, but you can even turn on clicking noises. ‘Click.’ ‘Click.’ ‘Click.’ This application will not leave you disappointed because with every feature comes more features! Like the Equations button.IMG_0222 
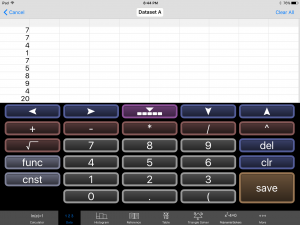
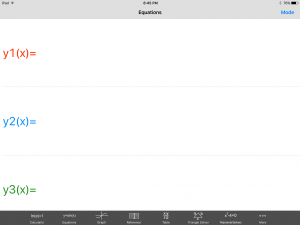
Pushing this opens a new menu that has more options in the upper right hand corner called Mode, and just wait there’s more. If you push the Mode button it opens? Yep, you guessed it, another menu with more feature! IMG_0223
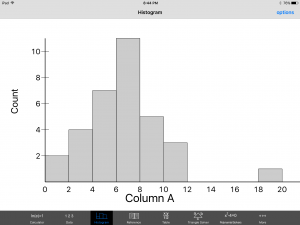
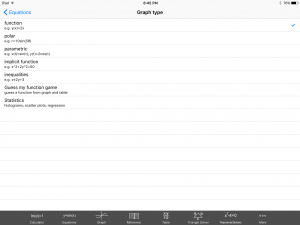
This time click the Statistics option and hear that ‘click’ sound play your favorite tune. ‘Click.’ Now don’t go away, if you place your order today we will throw in,  for absolutely free, that’s right, absolutely free data set entry into a spread sheet. Just enter your data set. Then here comes my favorite part, are your ready? Click the Histogram button at the bottom of the screen and ‘presto’, your histogram has been summoned. Turn every student in your class into a Mathamagician. That’s right! A Mathamagicaian, and bring your lessons to life. And if you order your copy of GraCalc between now and Armageddon, I’ll cut the cost in HALF. That’s right, In half. Not good enough, you say? Well finish reading this blog and I let you have the app for my famous low, low, super duper,  can’t get a better deal anywhere price of… are your ready? FREE, Yes I said it, Freeeeeeeeeeeeeeeeeeeeeeee.

Obviously, if your still reading this blog I caught some kind of interest in you. This application that is officially called ‘Free GraCalc’ is created by William Jockusch and has many useful features. However, for the purpose of this blog I choose to talk about the statistics side of the application. Particularly, if you want to help your students understand that any data set can be put into a histogram that then can be used to interpret the data. For example, I entered a few low random numbers into the spread sheet and had the application build me a histogram. IMG_0221
IMG_0220

From this histogram we can make a few conclusions, one being that the entry at 20 most likely is an outlier because it is fairly far from the rest of the data. Simply put, this application puts powerful tools into the hands of your students and can truly bring your mathematics to life. It is a free application on the iPhone as well as on the iPad. I included with this post a full lesson plan to help show how a teacher could include this application as both a learning exercise on what histograms are and the information we can gather from them. Also included in my lesson plan through the class activity will be a quick easy to follow application tutorial to help introduce the students to one of the many feature this powerful app has to offer. So go fourth and teach with style. Turn every one of your students into Mathamagicians!

Common Core Standard used in lesson plan with technology in mind:

CCSS.MATH.CONTENT.HSS.ID.A.1
Represent data with plots on the real number line (dot plots, histograms, and box plots).

Lesson Plan:

Lesson Plan Histograms using Technology

CCSS.MATH.CONTENT.HSG.CO.D.12 Mystery of the Points: Finding the Euler Line

download

Every student who has passed through high school Geometry has at one point or another used a compass and a straight-edge. As anyone who has used will tell you, it gets pretty messy. The lines never exactly match up and the paper gets covered in eraser marks and holes. So why not clean it up? Geogebra is a free Geometry software similar to Geometer’s Sketchpad. The software allows the user to cleanly perform Geometric construction on a computer that are typically done with a compass and a straight edge. What makes the software so dynamic is that the drawings are 100% movable and interactive. This allows students to explore areas of Geometry that were once limited by what can be created with a compass and straight-edge.

Euler Line

A great use of this software is in lessons like “Mystery of the Points.” In this lesson students use Geogebra to explore the relationship that the Circumcenter, Orthocenter, and Centroid  have with each other. Students construct these points in the software and interact with them in ways not possible with pencil and paper. Students get to “discover” facts about these points and take ownership of their learning. When student’s take charge of their learning, there is a sense of confidence and pride in their work that can really change lives.

Beyond just lesson activities, this software can be used to make presentation pieces as well as develop graphics for worksheets. Students can even download the software at home to use on homework or to explore beyond what is taught in class. This software is an easy, fun way to integrate technology in the classroom. Students will get excited about learning and gain confidence.

Mystery of the Points Lesson Plan Mystery of the Points Worksheet

Mystery of the Points Lesson Plan

CED.A.2-Who Saves More?

geogebra

In this article you will see a lesson that uses the technology of GeoGebra. GeoGebra is a free software that can do many things. The program allows you to do basic graphing and can find intersections points as well as make shapes. The lesson uses GeoGebra to graph functions that students came up with to model a given situation. The students can use the program to find intersection points in two equations or find end behavior. The lesson uses the GeoGebra as a tool to aid in students learning.

Who Saves More Lesson Plan

Who Saves More WS