Hot Wheels and Parabolas – HSF.IF.C.7 and HSF.BF.A.1.A

screen-shot-2016-11-01-at-5-19-48-pmscreen-shot-2016-11-01-at-5-21-27-pm

Students will be working in groups, racing (pushing) Hot Wheels cars of varying sizes up a ramp and letting it fall back to the starting point. When the cars are pushed up a ramp, at some point, they will stop moving forward and begin to roll back to the ground; this relationship between the position of the cart and the time elapsed is representational of the quadratic equation in general form.

In this activity students will be conducting an experiment and collecting data to find what the quadratic equation will be to represent them pushing their car up the ramp and it returning back to the ground.

This activity is aligned with the following Common Core State Standards:

  • MATH.CONTENT.HSF.IF.C.7: Graph functions expressed symbolically and show key features of the graph, by hand in simple cases and using technology for more complicated cases.
  • MATH.CONTENT.HSF.BF.A.1.A: Combine standard function types using arithmetic operations. For example, build a function that models the temperature of a cooling body by adding a constant function to a decaying exponential, and related these functions to a model.

For this activity students will use a Motion Detector to measure the position of the car on the ramp along with the change in time. The students will collect this data and analyze it to look for key locations on the parabolic curve so that they can write an appropriate quadratic equation for their particular car rolling up and down the ramp.

screen-shot-2016-11-01-at-4-31-22-pm


Activity:hot-wheels-and-parabolas

Resources: https://www.vernier.com

Logger Pro Ball Throwing Project CCSS 8.F.A.2

Have you ever had a difficult time finding a math project that is both engaging for students and involves technology? Vernier products are wonderful tools for projects such as these, that can be very difficult to implement in the classroom. However, with these tools there are infinite possibilities for engaging projects. One product that is popular is called Logger Pro. This software allows students to take videos of any motion or movement and upload those videos to Logger Pro. Logger Pro can then plot those motions in relation to both the x and y axis, and allow students to find regression lines through the data points. This software is a way for students to be creative and see the connections between the math that they are using and the real world. For more information about Logger Pro, visit: http://www.vernier.com/products/software/lp/


logger-pro-picture-example

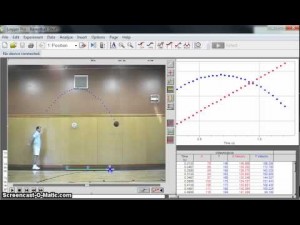
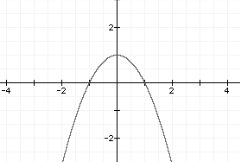
An example of a great project for students to do with this Logger Pro Software is a project where students get into groups, film each other throwing a ball back and forth with different speeds and different heights, create the plot points of the movements on Logger Pro, find the regression equations of those points in relation to the x and y-axis, and then analyze the differences between the throws and their relationship to the matching graphs.


sports-balls

For this project, students will need some extra materials such as a video camera (can use phone), a ball of their choosing, and Logger Pro.

The standards that align with this project are:

CCSS.MATH.CONTENT.8.F.A.2

Compare properties of two functions each represented in a different way (algebraically, graphically, numerically in tables, or by verbal descriptions). For example, given a linear function represented by a table of values and a linear function represented by an algebraic expression, determine which function has the greater rate of change.

CCSS.MATH.CONTENT.8.F.B.5

Describe qualitatively the functional relationship between two quantities by analyzing a graph (e.g., where the function is increasing or decreasing, linear or nonlinear). Sketch a graph that exhibits the qualitative features of a function that has been described verbally.

throwing-a-ball


This activity should be used in math classes because it shows students that math is involved with the real world and can be applied to their interests and things they are familiar with such as sports. It also allows students to be able to work in groups, can be adjusted to fit the community, students’ experiences, or interests since they can throw balls of varying types. The technology of Logger Pro also exposes students to the use of technology to solve math problems. In this case, students will be using technology of video cameras to record the throws, computers to access Logger Pro, and the software of Logger Pro. This activity is additionally a way to enhance teaching of common core standards for mathematics because it gets students physically, technologically, and mentally involved with math, by relating math to what they are familiar with like throwing a ball, and is a way to get students away from direct instruction.

To see the work sheet corresponding to this activity, go to the link below:

throwing-a-ball-project-directions


How fast is water decreasing? HSS.ID.B.5-6

How fast is water decreasing?

Students will be working in groups to find the relationship between weight of water versus the time water drains completely from the funnel.

In this activity, students will work in small groups to collect data, and based on the data points, they will interpret the slope of the line. Students will model the weight of water versus time data for a draining funnel. In addition, another objective that students will cover is that they will be able to describe the data using the concepts of intercept and slope of a linear function.

screen-shot-2016-11-01-at-10-45-42-am


This activity is aligned with:

  • CCSS.MATH.CONTENT.HSS.ID.B.5 Summarize categorical data for two categories in two-way frequency tables. Interpret relative frequencies in the context of the data (including joint, marginal, and conditional relative frequencies). Recognize possible associations and trends in the data.
  • CCSS.MATH.CONTENT.HSS.ID.B.6.A Fit a function to the data; use functions fitted to data to solve problems in the context of the data. Use given functions or choose a function suggested by the context. Emphasize linear, quadratic, and exponential models.
  • CCSS.MATH.PRACTICE.MP1: Making sense of problems and persevere in solving them.

Knowing the general equation of point-slope form of a line, students will write the equation of the line fitting the data collected. They will record the y-intercept in the data table. With their graphing calculators, students will determine if the line is the best fit for their data, and explain their reasoning if the line passes through any particular points.

How fast is water decreasing? Activity how-fast-is-h2o-decreasing

Modeling Pressure: Building Functions F-BF

Product in use image for Pressure Sensor 400Observing the production of carbon dioxide from calcium carbonate and dilute hydrochloric acid

Pressure Sensor 400 by Vernier is a piece of technology used to calculate pressure create by chemical reactions. If were to make a lesson using this I would first speak with a science teacher and find out if you could co-create a lesson plan together using this technology. So in science the students would go over the chemical reaction and why pressure was being produced and then in math students would create a model that represents how the pressure built over time. The labs would already be set up and students would have already done it once to observe the reaction so students could reproduce the same experiment but this time focus on the model created by it. The data collected by the sensor can be sent to computer to create a model where students will interpret what type of function represents that model and derive an equation for it. This lesson help students understand how math relates to other curricula and how it can be used in the real-world. Also, this lesson will help students get used to using technology and therefor learning the set of skills required to interpret how to best use technology.

If you wanted to involve community I believe that this lesson could be done in a lab where students could set the labs up, perform the experiment, and derive functions for the given models while family and friends watch, sort of a presentation of their science and math skills. Students/lab groups could then present their findings to the audience at the end. this would allow family and friends to see what the students are learning and for students to show off what they have learned. also this would allow parents to witness your teaching first-hand. this idea however would require a lot of safety precautions since chemical reactions would be going on.

Slopes and Cents- HSS.1D.B5

What is the relationship between weight and quantity?

Taking into consideration that the slope of a line describes its steepness. We can also say that the slope can represent a number of other important mathematical concepts, such as the relationship between the weight of an object and its quantitypennies. This relationship can be modeled graphically by plotting the measure of the different amount of pennies versus its weight. In this activity, in small groups, we will use a Force Sensor to collect a linear set of data points. We will measure the weight of 8, 16, 24, and 32 pennies. Using this information, we will analyze the data and interpret the meaning of the slope as it relates to the independent and dependent variables. Using a model, we will be able to predict future measurements and interpret past results. tool

In the Slope and Cents activity, students will work in small groups to collect the data and collaborate to interpret the slope of the line they come up with using their data points. The objective of this activity is for students to collect weight versus number data for a collection of identical pennies. Model the weight versus data using linear equations. And lastly, interpret the slope and intercept values from the linear model.  experiment

Materials to complete this activity:

  • Dual-Range Force Sensor
  • Interface
  • LabQuest
  • Pennies or any coin you choose to work with.

This activity aligns with:

  • CCSS.MATH.CONTENT.HSS.ID.B.5
    Summarize categorical data for two categories in two-way frequency tables. Interpret relative frequencies in the context of the data (including joint, marginal, and conditional relative frequencies). Recognize possible associations and trends in the data.
  • CCSS.MATH.CONTENT.HSS.ID.B.6
    Represent data on two quantitative variables on a scatter plot, and describe how the variables are related.
  • CCSS.MATH.CONTENT.HSS.ID.B.6.A
    Fit a function to the data; use functions fitted to data to solve problems in the context of the data. Use given functions or choose a function suggested by the context. Emphasize linear, quadratic, and exponential models.
  • CCSS.MATH.PRACTICE.MP1: Making sense of problems and persevere in solving them.
A benefit of using technology when teaching this concept is that you make the concept hands on relatable by incorporating coins. Using an object that students are exposed to on a daily basis allows the students to bring the object from the real world into the classroom. And most importantly using activities like this allows students to move around and get involved rather than sit and read information out of a textbook. Students get to collect their own data rather than take a list provided for them. By doing this, you engage a wider range of your students.
Slopes and Cents activityslopes-and-cents
Link to website of equipment and activities: #standards

Chasing the Storm H.A.REI.1-3

screen-shot-2016-10-26-at-8-36-50-am

Do you want to incorporate an activity to reinforce students’ understanding about graphing inequalities? This activity will allow your students to apply their knowledge of inequalities, and apply it to a real world application. Students will be able to analyze a specific storm of their choice from The Weather Channel, and find the best equation that models the movement of a storm. Desmos is a free software where students can enter equations of their choice and analyze the graph of the expression. They will instantly see how the graph looks like after typing the equation. Students will be able to explore and find out how changing a constant or a variable can make a change. This resource is free and useful for student to familiarize themselves with different graphs.

Lesson Plan math-lesson-chasing-the-storm

Continue reading

The Population Pandemic HSF.LE.A1

Image result for population graph

As the modern medicine and effective food methods become increasingly efficient, humans are able to populate more and more of the Earth. However, as we approach a net population of just over 7 billion and the Earth only holding a population threshold of over 12 billion, we must ask ourselves how long do we have before we overcome Earth’s population threshold?

With the help of a trusty TI-83 calculator teachers and students alike can find the answer to that question and more. Just follow the link lesson plan below to start an interactive and real-world activity that the students are sure to find relevant and engaging.

modeling-activity-lesson-plan

Battleships and Mines HSG.GPE

screen-shot-2016-10-26-at-12-53-10-am

What better way to learn math than by playing Battleships and Mines!!!

This interactive activity will indulge your students into creating their own battleships and mines using geometry. Students will generate their battleships and mines using equations of circles that will be graph using GeoGebra. GeoGebra is a free and useful software where students can create circles with just two clicks! No more “I do not want to graph this!” With GeoGebra students will be able to fully engage in the activity while practicing the properties of the equation of a circle, without the hassle of graphing it. GeoGebra not only does it have functions that can be incorporated with algebra and calculus curriculum, but it comes at no cost to schools, teachers and students.

battleships-lesson-geometry-m325


Exploration of the Euler Line using Geogebra- HSG.CO.D.12

screen-shot-2016-10-25-at-11-16-00-pm

This lesson focuses on the use of modeling in Geogebra to help students explore the concept of the Classical Triangle Centers (centroid, orthocenter, and circumcenter) and how they relate to the Euler Line. In the activity for this lesson, students will be asked to make constructions of triangles using Geogebra, and manipulate the vertices of the triangles to answer a series of questions relating to the centroid, orthocenter, and circumcenter. They will also be asked questions that will help them to further explore the relationship between these three centers of a triangle.

Lesson and Activity Link: euler-line-modeling-lesson-plan

Shifting, Reflecting and Stretching With DESMOS: HSF.BF.B.3

article

This lesson is project base. Students need to use DESMOS, to model different functions as well as to interpret the behavior of the model (graph). This lesson requires students to follow instructions, analyze graphs, explain the behavior of the graph, to check their work, create accurate models and explain their reasoning. Students need to work individually to complete this project. DESMOS is a graphing software that students can use to visualize concepts.

Lesson Link: shiftingreflectingandstretching