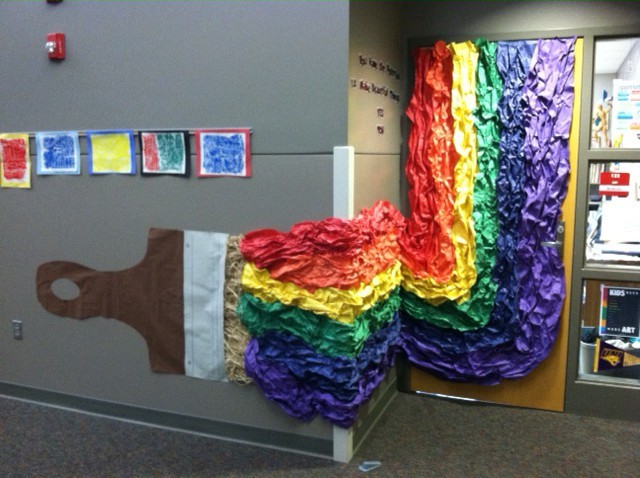
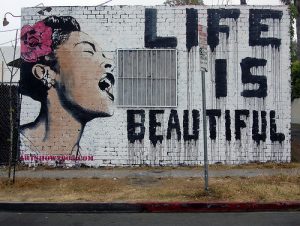
Ratios and Recipes! 6.RP.A

This lesson is a real world activity to be used as the last lesson of the unit. Students use a recipe to adjust the ingredients based on a new serving size. Students use their understanding of ratios and proportions to solve the equations and come up with the new serving size. This activity allows students to use what they have learned about ratios and proportions from the previous lessons and apply them to a real world problem.

CCSS.MATH.CONTENT.6.RP.A.1

Understand the concept of a ratio and use ratio language to describe a ratio relationship between two quantities. For example, “The ratio of wings to beaks in the bird house at the zoo was 2:1, because for every 2 wings there was 1 beak.” “For every vote candidate A received, candidate C received nearly three votes.”

CCSS.MATH.PRACTICE.MP1 Make sense of problems and persevere in solving them.

CCSS.MATH.PRACTICE.MP4 Model with mathematics.

Ratios and Recipes!

Count the Rainbow CCSS.Math.Content.7.SP.C.6

Learning Objective: I can collect the probability of Skittle colors and determine a relative frequency.

This is a real world application problem connecting probability in a context students enjoy and understand, candy! This activity allows students to evaluate a regular sized packet of Skittles by determining the frequency of each flavor. Everyone has a favorite Skittle, whether it is the cheery red or the new green apple green. This way students can evaluate how frequent their favorite colored Skittle is in typical packet of Skittles. As students participate in this activity they are connecting aspects of mathematics into a context problem that appeal to their lives. When students relate mathematics to real life situations they are able to connect its importance. Then, students can participate in a mathematical discussion to reason abstractly about the probability of different colored Skittles to determine the relative frequency found in all bags. As they discuss the problem students will be making sense of problems. When the students discuss the frequency and probability of skittles in the bag, they can relate it to the production of Skittles, which opens a discussion where students participate as responsible citizens by gaining further knowledge.

As students investigate the frequency of skittle flavors in their designated bags, they can create different representations to demonstrate the date. These representations can be frequency tables, frequency graphs, pictograph, histograms, line graph, bar graph, etc. As they apply these different representations the Skittle problem they are practicing areas of mathematics. Also, students can then relate the information to their classmates and discover patters to determine the relative frequency of Skittle flavors.

CCSS.Math.Content.7.SP.C.6
Approximate the probability of a chance event by collecting data on the chance process that produces it and observing its long-run relative frequency, and predict the approximate relative frequency given the probability. For example, when rolling a number cube 600 times, predict that a 3 or 6 would be rolled roughly 200 times, but probably not exactly 200 times.

CCSS.Math.Practice.MP1 Make sense of problems and persevere in solving them.

CCSS.Math.Practice.MP2 Reason abstractly and quantitatively.


Let’s Head for the Hills 6.EE.C

With hiking season right around the corner, your friends and you decide to plan a backpacking trip to a lake. During the planning process, you want to figure out how long it will take to hike the trail to your camping destination. By doing some investigative research, you are able to find a map of the trail with descriptions of the various inclines along the trail. Using your mathematical and problem solving skills, find out how long it will take you hike each part of the trail based on the incline and speed of travel to answer the ultimate question of how long it will take your friends and you to reach the camping destination at the end of the trail.

This lesson is geared for students to work in groups in determining the speed of travel along the various slopes of the trail. Students must use their mathematical reasoning and problem solving skills to calculate and solve this problem. Students can use a particular hiking trail of interest or the teacher can assign ones to the class.

This lesson is focusing on the CCSS.Math.6.EE.C.9- Use variables to represent two quantities in a real-world problem that change in relationship to one another; write an equation to express one quantity, thought of as the dependent variable, in terms of the other quantity, thought of as the independent variable. Analyze the relationship between the dependent and independent variables using graphs and tables, and relate these to the equation.

School Presidential Election 7.SP.A

School Presidential Elections

The students are learning about probabilities in math so they will apply these concepts to a real life event that happens every year in schools across our nation.This sample picture has so much meaning to all the students in the entire 7th grade class as it is about school culture. There is a number of probability activities this simple picture can expand to using mathematical practices as to who will win the election. Activities like: Will it be a girl or boy? Will it be the popular student or the student that delivers the best speech? Based on a mini session of class voting, will it be an accurate representation of the actual event?  For this particular activity there is a total of 6 students in the running for class president, 2 boys and 4 girls. The students will use red poker chips for the girls and blue poker chips for the boys as well as a randomization holder (paper bag). This process will help determine whether a girl or boy will be president based on some fun probability activities (SEE HANDOUT ATTACHMENT). The students will also explain as to what parts of the activity are empirical or theoretical and why as well as learn the Law of Large Numbers. This activity aligns with CCSS.MATH.CONTENT.7.SP.A.1 & 2

PictureProblemActivity

Perfect Purple Classroom! 6.RP.A.3

CCSS.Math.Content.6.RP.A.3
Use ratio and rate reasoning to solve real-world and mathematical problems, e.g., by reasoning about tables of equivalent ratios, tape diagrams, double number line diagrams, or equations.

CCSS.Math.Practice.MP4 Model with mathematics.

CCSS.Math.Practice.MP5 Use appropriate tools strategically.

CCSS.Math.Practice.MP3 Construct viable arguments and critique the reasoning of others.

Lesson objective: I can create a model that shows how two values compare to one another.

This is a real-world activity to introduce proportions and ratios. This activity allows students to see that proportions are not just something you see on math worksheets, but in everyday life. This lesson relates to the fine arts, which helps culturally diverse students learn the mathematical concept better. Fine arts such as painting has been known to express complex cultural issues and their heritage has been translated into exchangeable value. The intuitive need for students to express themselves is precisely why the arts are an ideal vehicle to develop language, deliver content, and encourage academic exploration in school in culturally responsive ways. Learning, communicating, and questioning in alignment with the arts develops a dynamic classroom environment where students are excited and engaged in this process. Therefore, integrating arts into learning results in a more engaging classroom for students of all backgrounds.

This activity relates to all students as we are talking about physically painting our classroom once students have accurately problem solved how to paint our classroom the perfect purple. In order to create the perfect purple color, we must need the perfect mixture: two cups of blue paint and three cups of red paint. After measuring our classroom, we decided we need a total of 35 cups of our perfect purple paint to coat the walls. Students will be given the opportunity to work with their peers and with manipulatives to decide how much of each color would be needed to make a total of 35 cups of perfect purple paint. The manipulative provided will be interlocking colored math cubes that the students can build the proportion of the ratio for every three cups of red there needs to be two cups of blue. Once students have had an opportunity to work through the problem using just the interlocking colored math cubes, their peers, and teacher as support, then students will present their ideas to the whole class. As the teacher guides this whole class discussion, the students and teacher will come to the conclusion of the correct amount of blue and red paint needed to create the perfect purple to paint our classroom.

Student Handout: MATH 325 perfect purple paint

Street Art CCSS.MATH.CONTENT.7.RP.A.1

By Banksy, UK.

Street Art or Graffiti as we commonly know it has endured an evolving history, its origins linked to both urban gangs as well as to pure artistic expression. Originally used by gangs to mark their territory, it has have now become a rich medium for unrestricted expression of ideas and statements. From the Berlin Wall to the democracy wall in Beijing, people have used street art to demonstrate some of their most poignant frustrations, concerns, or expressions of beauty about the world. It is time to give students a look, into the empower political, artistic, and mathematics involved in changing our cityscapes. Through this lesson plan students have the opportunity to use math and art to connect with cultures around the world.

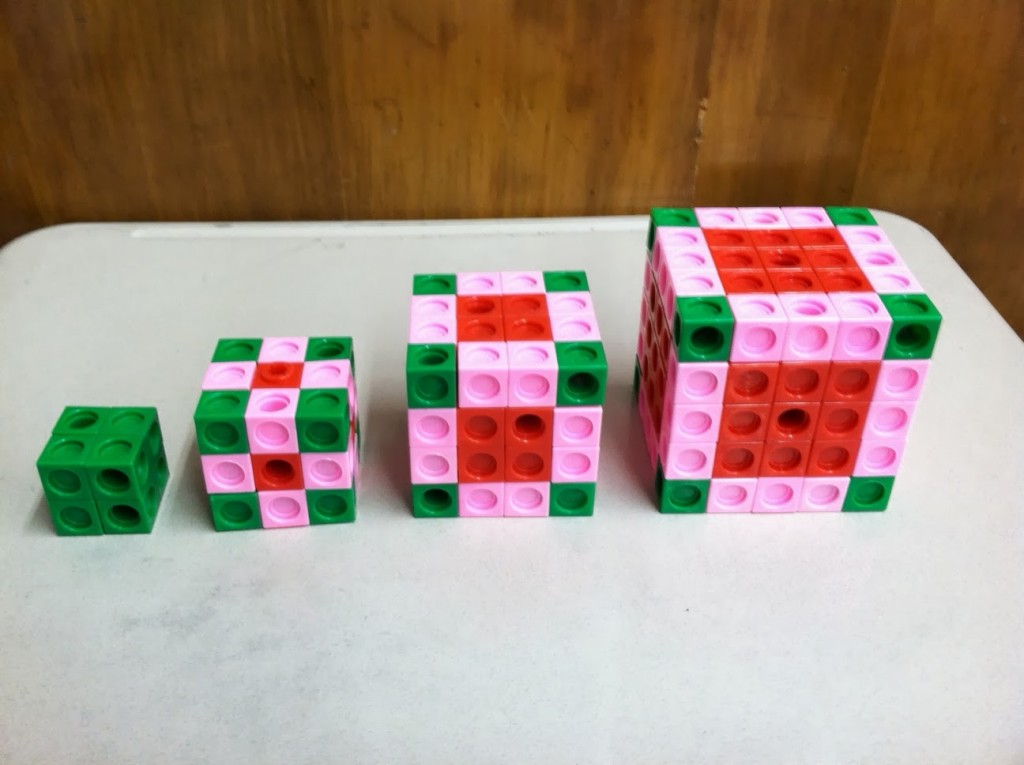
This lesson is suited for a 7th grade Math classroom and it gives us inclusive way to make mathematics more culturally accessible. Mathematics is often viewed as very Eurocentric. Students, regardless of background, often have an attitude of helplessness and powerlessness toward mathematics. This is done so by exposing them to ethno-mathematics. Ethno-mathematics is the study of the relationship between math and culture or the study of the mathematics practiced among cultural groups. The intent is to help students to realize the significance of math with their culture and other cultures. It reinforces the everyday value of math and the value in their ability to do mathematics. Explain to students that they will watch a video about an urban artist who uses ratios, scale, and proportion to plan and create his designs. Does anyone have any idea why? Have students plan out their designs on paper, they need to calculate the dimensions to figure out how to size the drawing properly on a large scale. Watch the video! And create.

Prior required knowledge: basic functions of math adding, subtraction, division, multiplication, basic reading, and writing. Vocabulary: ratio, scale, proportion, scaling, unit rate, factor, oppression, civil rights, gender, art, political science.

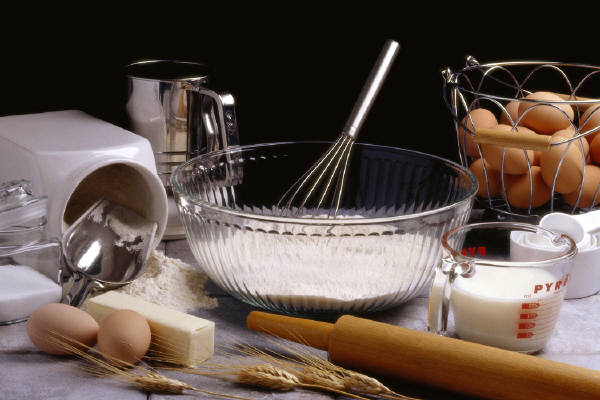
Materials: 1 drawing of their choice, centimeter ruler, 1/4″ grid paper, pencil per student. Colored pencils and large paper. Classroom internet access, viewing screen.

CCSS.MATH.CONTENT.7.RP.A.1 – Analyze proportional relationships and use them to solve real-world and mathematical problems. Compute unit rates associated with ratios of fractions, including ratios of lengths, areas and other quantities measured in like or different units.

CCSS.MATH.PRACTICE.MP4 – Model with mathematics.

Frozen Yogurt Party! CCSS.MATH.CONTENT.8.EE.C.7

This activity is a real-world problem that students may face in their life. It would be a great activity to introduce students to linear equations and graphing linear equations. During this activity, students can problem solve with a partner or group to figure out where they should have their frozen yogurt party based on the given information.

Attached below: A handout with directions and problems for students to solve.

This activity aligns with the the Common Core State Standards and the Math Practices:

CCSS.MATH.CONTENT.8.EE.C.7 Solve linear equations in one variable

CCSS.MATH.PRACTICE.MP1 Make sense of problems and persevere in solving them.

CCSS.MATH.PRACTICE.MP4 Model with mathematics.

Handout: Frozen Yogurt Party

Simple Picture or Mathematics? CCSSM6.R.P.1.

The picture above may look simple, but it is filled with math concepts. For this picture, students will be using a handout, like the one provided, to find ratios. In this picture, students will first be asked to look at the picture for about 5-10 seconds and record their guess of whether there are more circles or triangles in the picture. After making their guess, students will be asked to count the number of circles in the picture, and the number of triangles. Look closely! After finding both of those numbers, students will find the total, and then be asked to find certain ratios between the shapes. They can also be asked to explain what the ratios mean to help extend their thinking. This activity aligns with CCSSM 6.R.P.1.

Picture Blog Assignment

Painted Cube F.LE.A

painted-cube

The image can be use to teach students to create exponential functions, arithmetic series, description of the relationship of the different colors. Students make a list of the patterns in the cubes to help them create an equation that represent each of the cubes; to expand their thinking, they can create an equation that would give how many cubes of a given color depending on the area of the cube or the number of cubes used. To make the activity more engaging, providing students with wooden squares to recreate this image, would help students deepen their understanding of the problem. The image can be to teach ratios/proportions between objects.

HSF.LE.A.2

Cliff Diving HSN-VM.A.3

cliff_diver_acapulco_mexico

The picture above, would be use to teach different an application of quadratic functions as well as using vectors and velocity. We can find the height of the diver when given the time. We can also solve the maximum velocity a diver can reach. In addition we can find how much time in seconds it takes for a diver to reach the water. All these problems, require a vector diagram which can be interpreted using trigonometry.